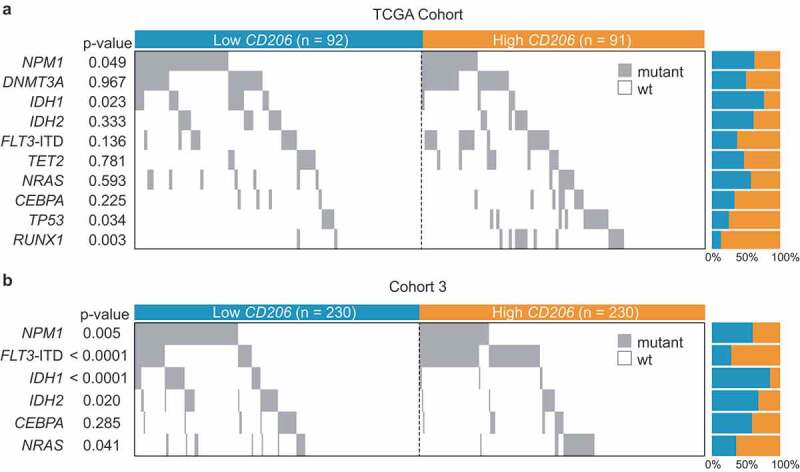
Figure 8.

Co-mutation plot showing the distribution of gene mutations in AML patients with low and high CD206 expression. (a) TCGA Cohort (n = 183); (b) Cohort 3 (n = 460). Each column represents an individual sample. Gray boxes indicate mutation and white boxes indicate wild type. ITD denotes internal tandem duplication.
