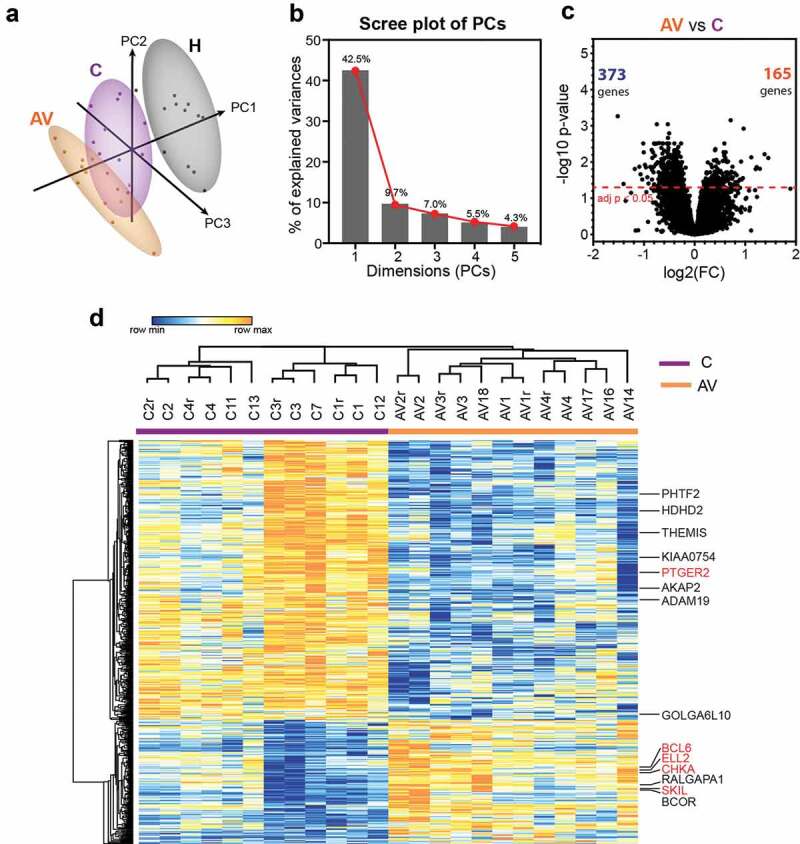
Figure 1.

Differential gene expression analysis between peripheral T lymphocytes from patients with melanoma (c) and patients with melanoma treated with AGI-101H 6 days after vaccine administration (AV) using HG U219 microarray data.
(a) Principal component analysis (PCA) of HG U219 microarray data for 19,285 markers from all biological replicates of AGI-101H-immunized patients 6 days after AGI-101H administration, patients with melanoma not included in the clinical trial, and healthy controls (n = 12). Numbers in parentheses reflect the percentage of total variance explained by the first and second PCs. Prediction ellipses are such that, with a probability 0.95, a new observation from the same group will fall inside the ellipse. Dots represent samples and are colored accordingly: black – healthy, purple – cancer (non-immunized melanoma), orange – AGI-101H-vaccinated melanoma 6 days after immunization. Samples from healthy subjects cluster together and are clearly demarcated from other groups. (b) Scree plot of the percent variability explained by each principal component. The first five principal components explain 69% of the variation. (c) Volcano plot of gene expression changes between untreated patients with melanoma (c) and patients with melanoma treated with the AGI-101H vaccine 6 days after vaccine administration (AV). The number of significantly differentially expressed genes (DEGs) with adj. p < .05 is shown in the volcano plot; orange – up-regulated, green – down-regulated markers. (d) Heatmap of 538 DEGs between peripheral T lymphocytes from patients with melanoma immunized with AGI-101H and non-immunized patients with melanoma (adj. p < .05). DEGs with |log2FC| > 1.0 are denoted and those selected for RT-qPCR validation are marked in red. Technical replicates in the microarray results are denoted with „r”.
