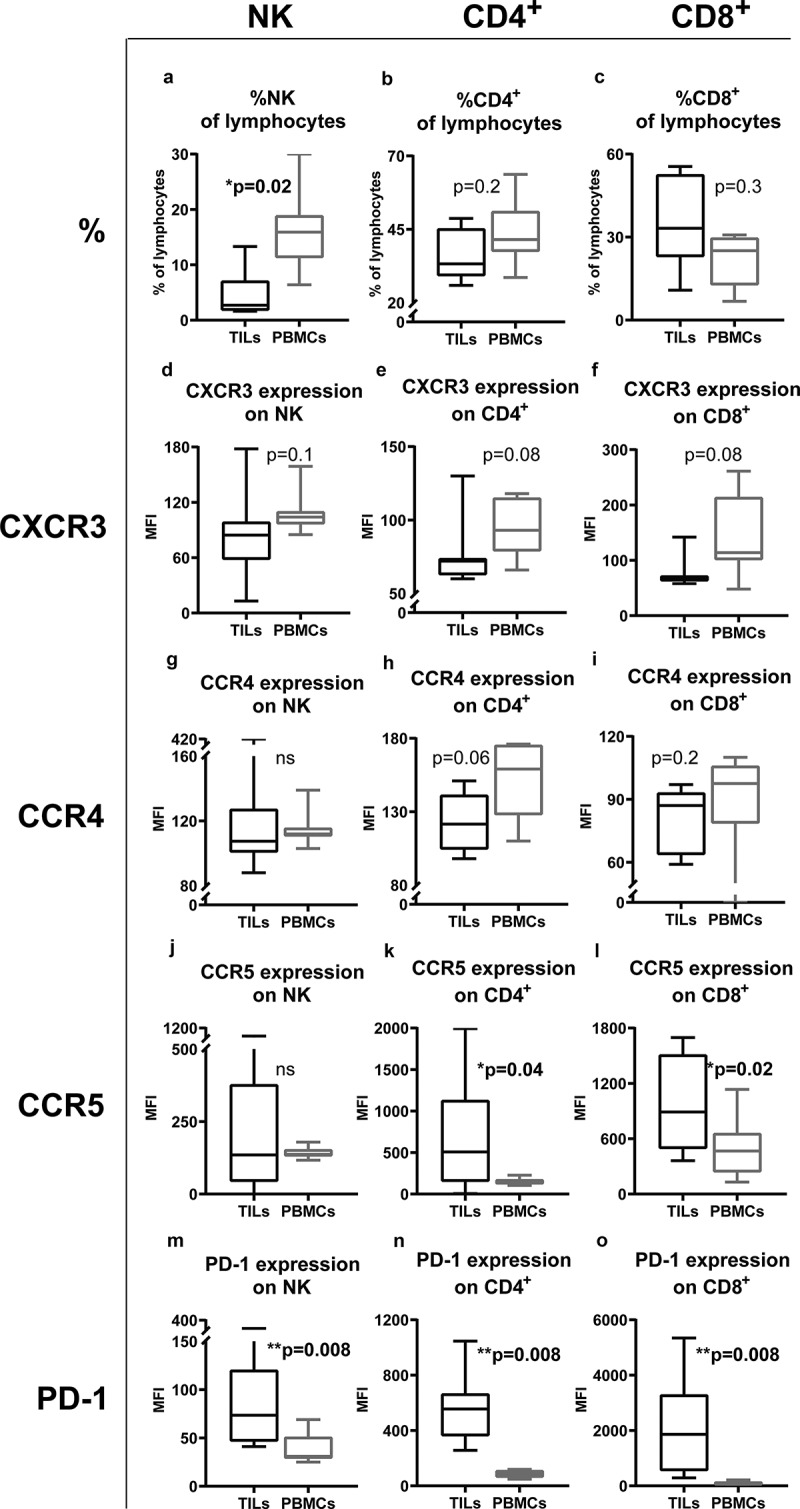
Figure 4.

Different expression patterns of receptors on TILs and on PBMCs.
The percentage of (a) NK cells, (b) CD4+ T cells and (c) CD8+ T cells among all lymphocytes in tumorbiopsies obtained during perfusion and in peripheral blood taken before ILP. Expression of (d-f)CXCR3, (g-i) CCR4, (j-l) CCR5 and (m-o) PD-1 on (d,g,j,m) NK cells, (e,h,k,n) CD4+ T cellsand (f,i,l,o) CD8+ T cells in tumors (TILs) and in peripheral blood (PBMCs) (n=8; paired Wilcoxon test). MFI = Median Fluorescence Intensity. Data are presented in box-and-whiskers plots with min. and max.
