Figure 5.

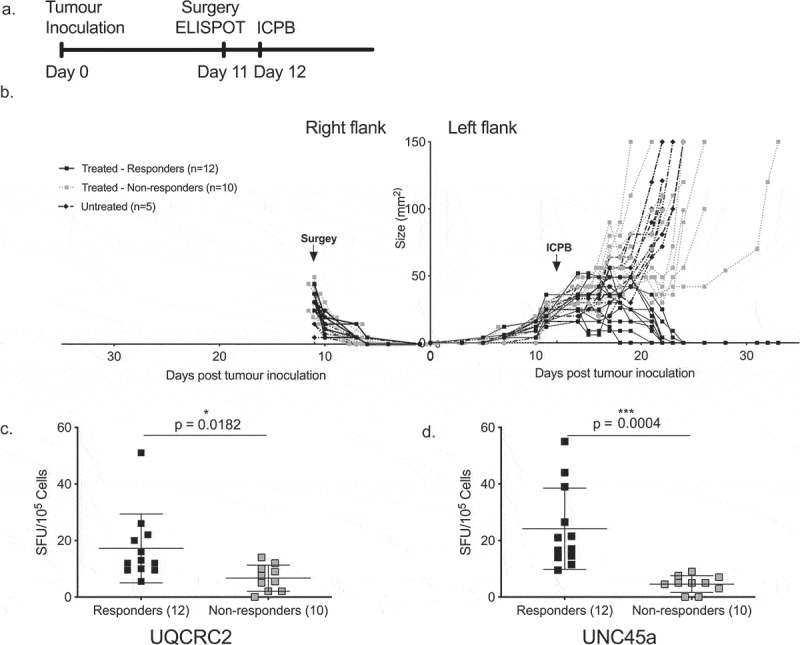
Strong dLN neo-antigen responses to UNC45a predict combination ICPB outcomes.
a. Schema of treatment and surgery. b. Bilateral tumor growth curve over time. Arrows represent surgery and treatment time (n = 22). Responses to therapy are depicted by black solid lines. Pre-treatment reactivity to c. mutant UQCRC2, and d. mutant UNC45a in the dLN of responders (n = 12) and non-responders (n = 10). Student’s T-test; error bars mean ± SD.
