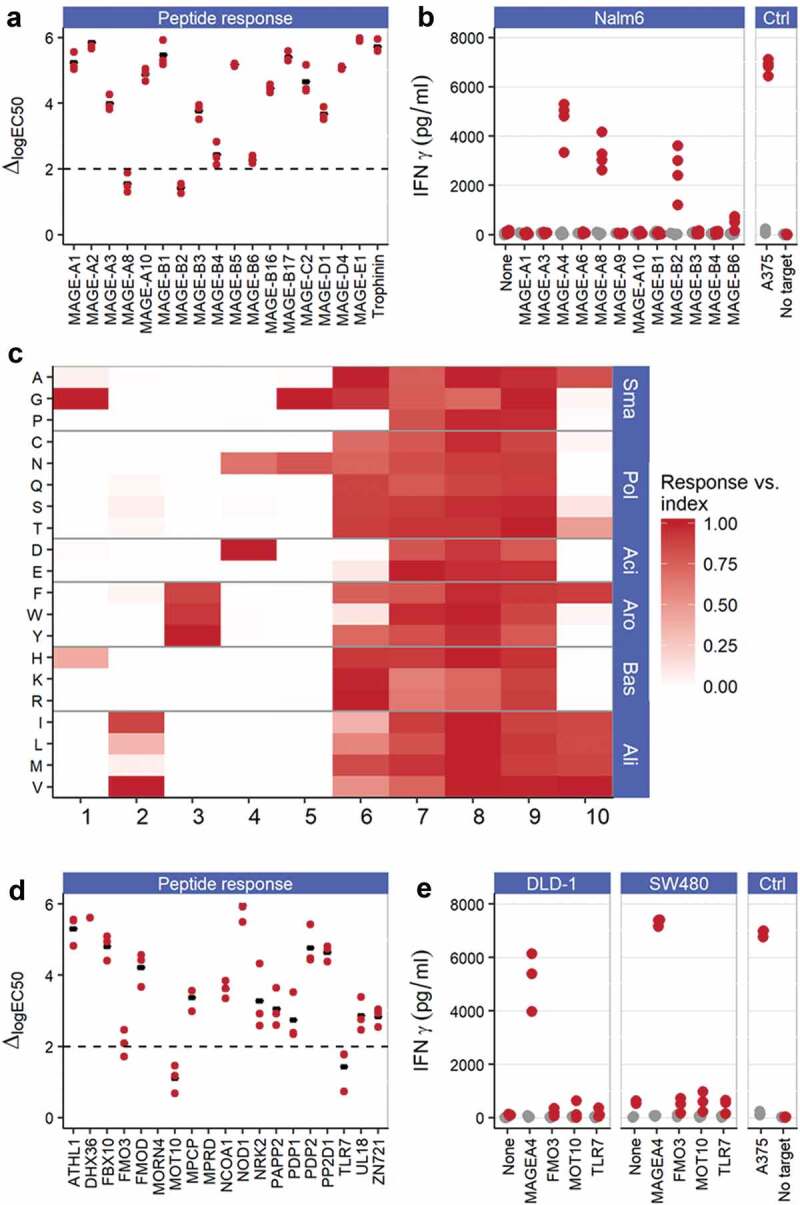
Figure 4.

ADP-A2M4 do not display relevant off-target peptide cross-reactivities. (a) ADP-A2M4 respond to MAGE-A8 and MAGE-B2 peptides and less strongly to MAGE-B4 and MAGE-B6 peptides. Data show the shift in logEC50 (ΔlogEC50) from index peptide when ADP-A2M4 were challenged with the peptides of interest. Each point shows the ΔlogEC50 for a single T-cell product (three T cell products tested); black bar indicates geometric mean. Y-axis truncated at 6 to exclude peptides with very weak responses where quantification of response is not reliable. Dashed line: logΔEC50 = 2. (b) ADP-A2M4 respond to Nalm6 cells transduced to express MAGE-A4, MAGE-A8, and MAGE-B2, but not other MAGE proteins. Points show IFNγ release from ADP-A2M4 (red points) and non-transduced cells (gray points), as determined by cell-ELISA. Each point reflects the average response of a single T-cell product in multiple independent experiments (three T cell products tested). (c) X-scan data show that the ADP-A2M4 TCR displays highly asymmetric specificity, with specific reactivity toward the N-terminal half of the index peptide, and promiscuous recognition of peptides containing substitutions within the C-terminal half of the peptide. Data show the response of three T-cell products toward indicated substitutions as fraction of response to MAGE-A4231-240. Substitutions divided by physicochemical properties: Sma: small; Pol: polar; Aci: acidic; Aro: aromatic; Bas: basic; Ali: aliphatic. (d) ADP-A2M4 respond to FMO3, MOT10, and TLR7-derived peptides. Data show ΔlogEC50 from index peptide when ADP-A2M4 were challenged with the peptides of interest. Each point shows the logΔEC50 for a single T-cell product (three T cell products tested); black bar indicates geometric mean. Y-axis truncated at 6 to exclude peptides with very weak responses where quantification of peptide response is not reliable. Dashed line: logΔEC50 = 2. (e) ADP-A2M4 do not respond to DLD-1 or SW480 cells transfected to express FMO3, MOT10, or TLR7 proteins. Points show IFNγ release from ADP-A2M4 (red points) and non-transduced cells (gray points), as determined by cell-ELISA. Each point reflects the average response of a single T-cell product in multiple independent experiments (three T cell products tested).
