
Figure 4.
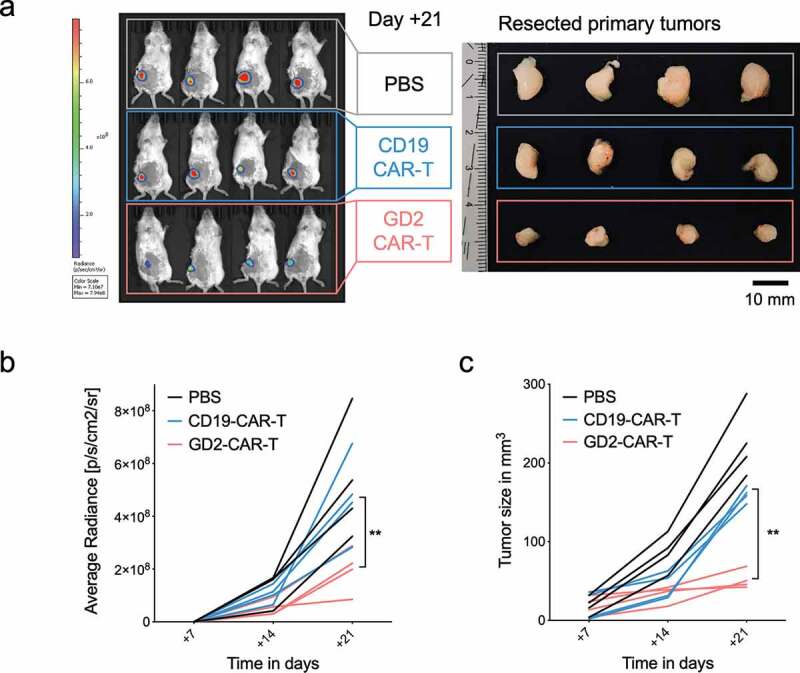
GD2-CAR-T cells arrest tumor growth in vivo. NSG mice were injected into the fourth mammary fat pad with 5 × 10⁶ MDA-MB-231 cells, stably expressing luciferase on day 0. On day +7, tumor-bearing mice were treated with either PBS, 5 × 10⁶ CD19-CAR-T or 5 × 10⁶ GD2-CAR-T. Mice were sacrificed on day +21. In a), noninvasive BLI images of luciferase activity at day +21 are shown for tumor burden assessment (left panel, n = 4). Resected tumors of the corresponding mice are shown in the right panel. In b), BLI signals above a 10% threshold were quantified as average radiance [photons/second/cm2/sr]. Timepoints day +7, injection of CAR-T, day +14 and day +21, end of the experiment, are shown. (Of note, for day +7 values were set 0 as no signals above a 10% threshold could be calculated. Corresponding optical imagines are given in Suppl. Figure 4a). In c), tumor growth kinetics are demonstrated as determined by caliper measurement. Data shown represent mean ± SD of 4 mice each group. (** = p < .001).