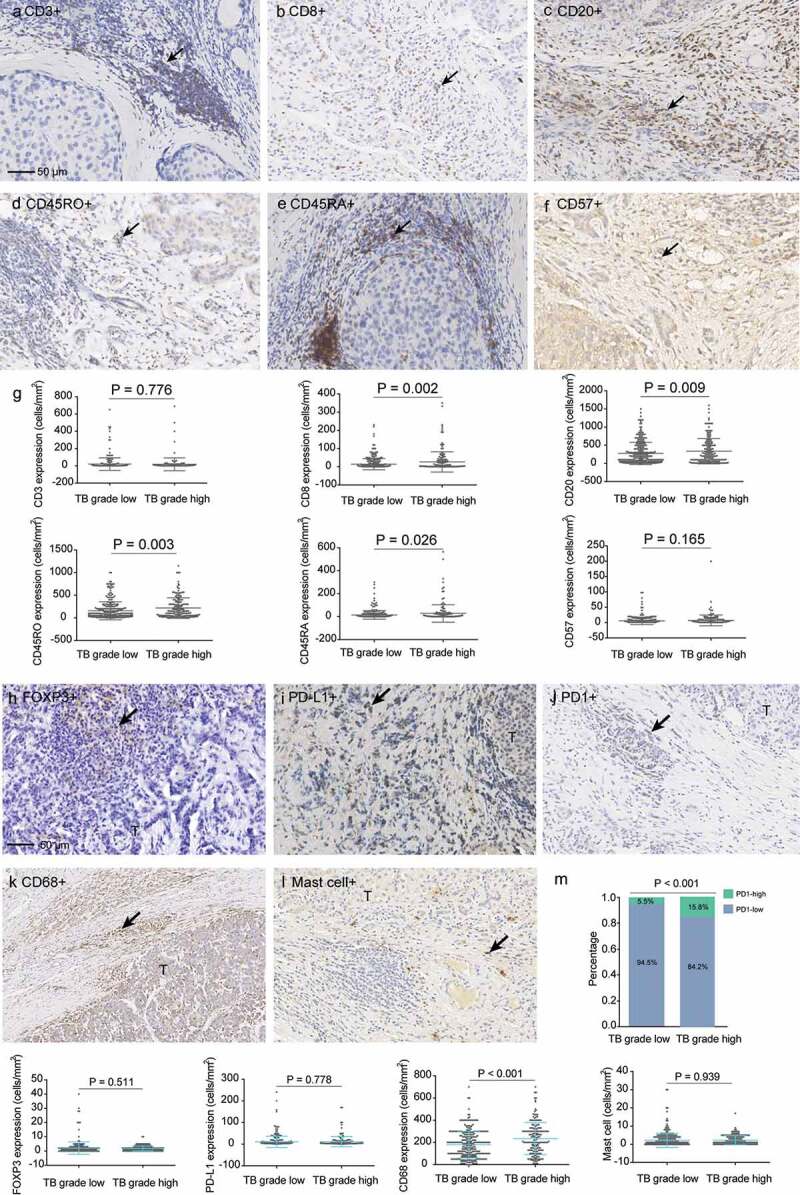
Figure 4.

Associations of tumor budding with immune cell infiltrations. (a–f) representative images of CD3, CD8, CD20, CD45RO, CD45RA, and CD57. (g) Associations of tumor budding grade with expressions of CD3, CD8, CD20, CD45RO, CD45RA and CD57 in the tumor samples. (h–l), representative images of FOXP3, PD-L1, PD1, CD68 and mast cells. (m) Associations of tumor budding grade with expressions of FOXP3, PD-L1, PD1, CD68 and mast cells.
