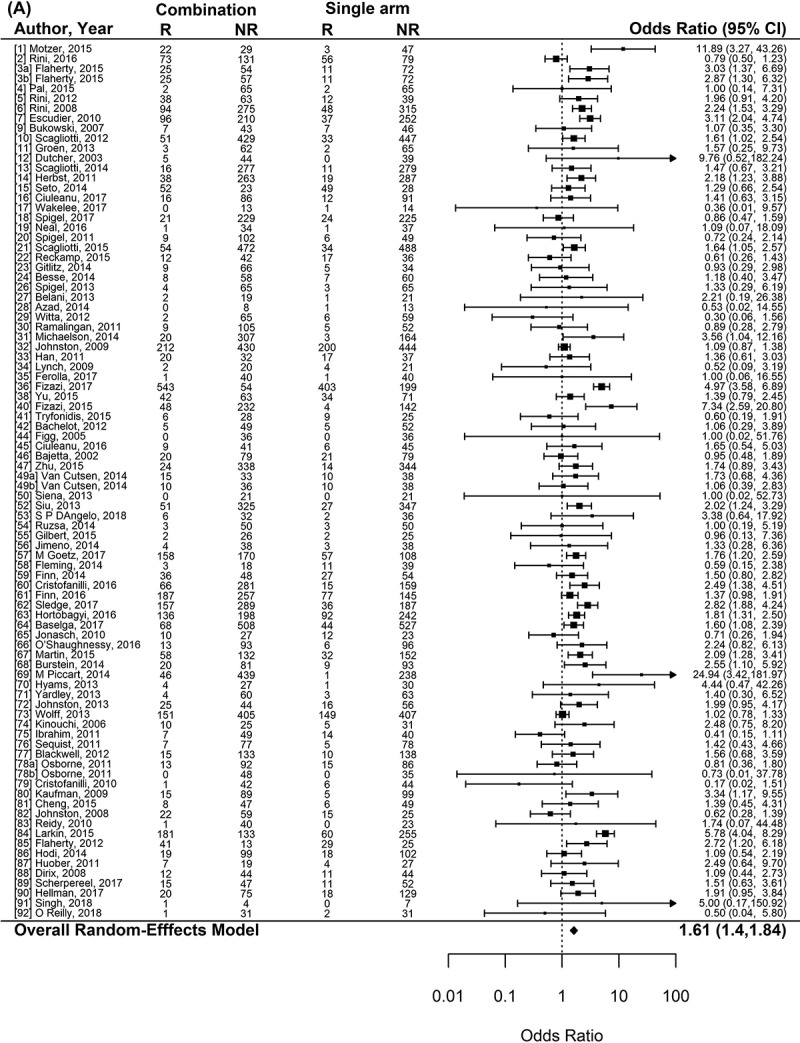
Figure 1.

Forest plot representing the odds ratio for response rate (A) and hazard ratios for PFS (B) and OS (C) for experimental arms with combination of therapies compared to experimental arms with single-agent non-cytotoxic therapies. Studies are labeled by first author’s last name and year of publication and numbers in brackets are labeled according to supplementary references. Panel A shows odds ratio (95% confidence interval) for response rate for each randomized trial comparing combinations to single agents. The plot shows an overall increase in response rate for combinations: OR (95% CI) = 1.61 (1.40−1.84) (p < .001). Panel B shows hazard ratio (95% confidence interval) for PFS for each randomized trial comparing combinations to single agents. The plot shows an overall increase in PFS for combinations: HR (95% CI) = 0.75 (0.69–0.81) (p < .001). Panel C shows hazard ratio (95% confidence interval) for OS for each randomized trial comparing combinations to single agents. The plot shows an overall increase in OS for combinations: HR (95% CI) = 0.87 (0.81–0.94) (p < .001).
Abbreviations: CI: confidence interval; NR: non-responders; OS: overall survival; PFS: progression-free survival; R: responders: RE model: random-effects model.
