
Figure 2.
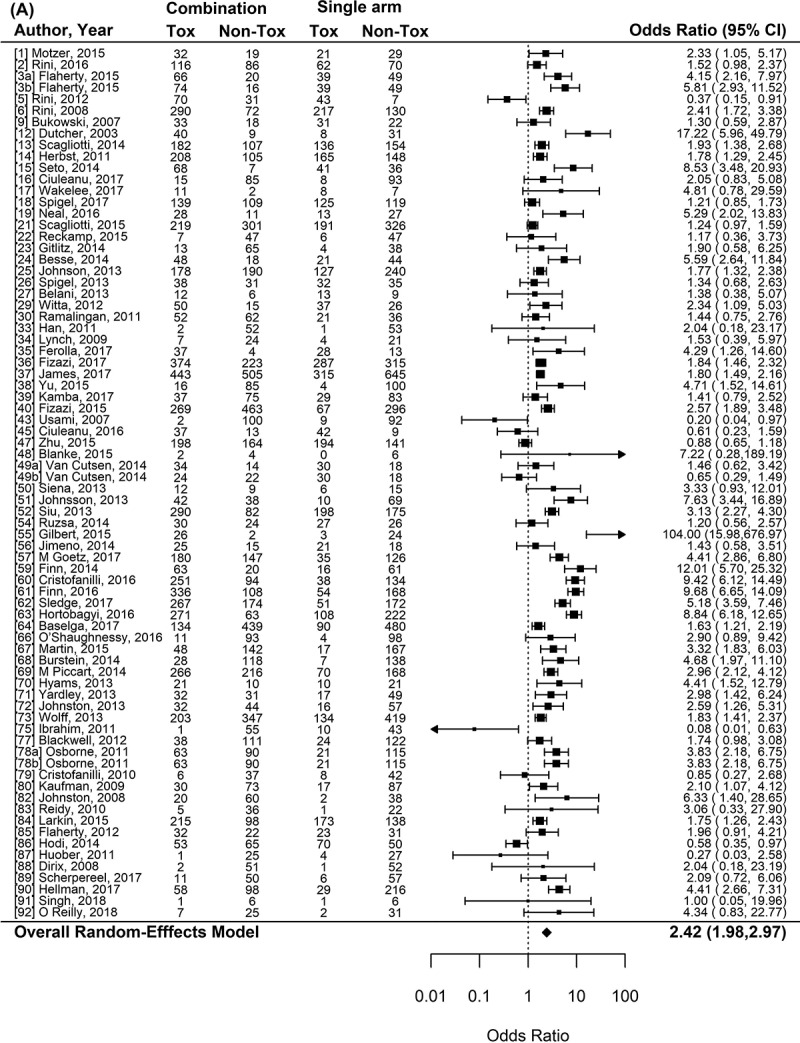
Forest plot representing the odds ratio for high-grade toxicities (A), and for treatment-related mortality (B) for experimental arms with combination of therapies compared to experimental arms with single-agent non-cytotoxic therapies. Studies are labeled by first author’s last name and year of publication and numbers in brackets are labeled according to supplementary references. Panel A shows odds ratio (95% confidence interval) for high-grade toxicities for each randomized trial comparing combinations to single agents. The plot shows an overall increase in high-grade toxicities for combinations: OR (95% CI) = 2.42 (1.98−2.97) (p < .001). Panel B shows odds ratio (95% confidence interval) for treatment-related mortality for each randomized trial comparing combinations to single agents. The plot shows an overall increase in treatment-related mortality for combinations: OR (95% CI) = 1.33 (1.15–1.53) (p < .001).
Abbreviations: CI: confidence interval; Non-Tox: number of patients without high-grade toxicities; OR: odds ratio; Tox: number of patients with high-grade toxicities: RE model: random-effects model.