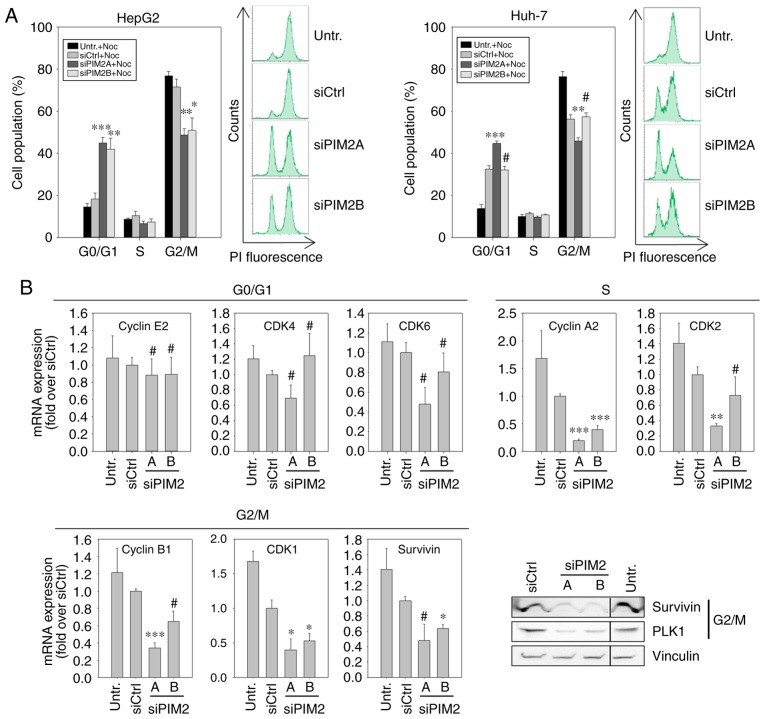
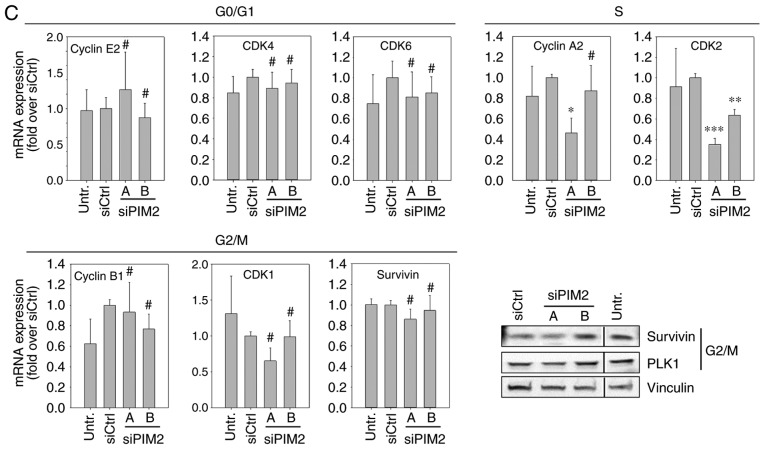
Figure 3.
Influence of PIM2 knockdown on the cell cycle of lines HepG2 and Huh-7 liver cancer cells. (A) Cell cycle distribution with nocodazole treatment was analyzed by FACS 72 h following transfection (n=4). Representative plots are shown. (B and C) The expression of cell cycle-related genes was analyzed at the RNA level by RT-qPCR (bar graphs, n=3) and at the protein level by western blot analysis (representative blots are shown), at 48 h or 72 h following transfection, respectively in (B) the HepG2 and (C) the Huh-7 cells. The black lines in the western blots indicate where an irrelevant lane was cut out.*P<0.05, **P<0.01 and ***P<0.001, significant differences compared to the siCtrl; the hash symbol (#) indicates that there were no significant differences. PIM2, proviral integration site for Moloney murine leukemia virus 2.


