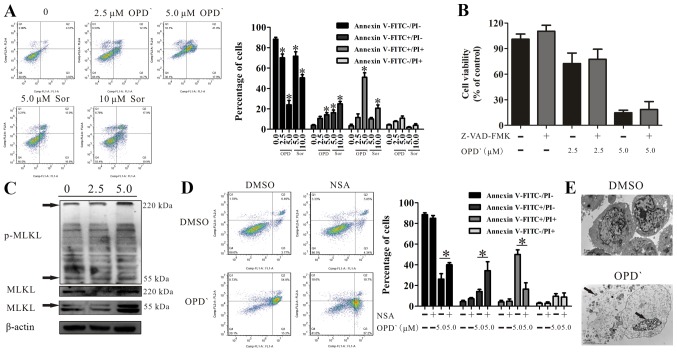
Figure 2.
OPD' induces necrosis in LNCaP cells. (A) Following LNCaP cell treatment with 2.5 or 5 µM OPD' for 24 h, the apoptotic rates were assessed by Annexin V-FITC/PI assay (n=3). *P<0.05 vs. vehicle. (B) The Cell Counting Kit-8 assay was used to analyze the effects of OPD' on cell survival following pre-treatment of LNCaP cells with Z-VAD-FMK (n=3). (C) Western blotting was used to examine the protein expression of MLKL and p-MLKL following 6-h treatment with OPD'. (D) Annexin V-FITC/PI staining was used to analyze the apoptotic rates of LNCaP cells following treatment with OPD' and NSA. (E) Treatment with 5 µM OPD' induced changes in cell morphology, as indicated by transmission electron microscopy. Arrows indicate leaked contents of the cell and cleavage of the cell nucleus. *P<0.05. OPD', Ophiopogonin D'; Sor, sorafenib; PI, propidium iodide; MLKL, mixed lineage kinase domain-like protein; NSA, necrosulfonamide; p, phosphorylated.

