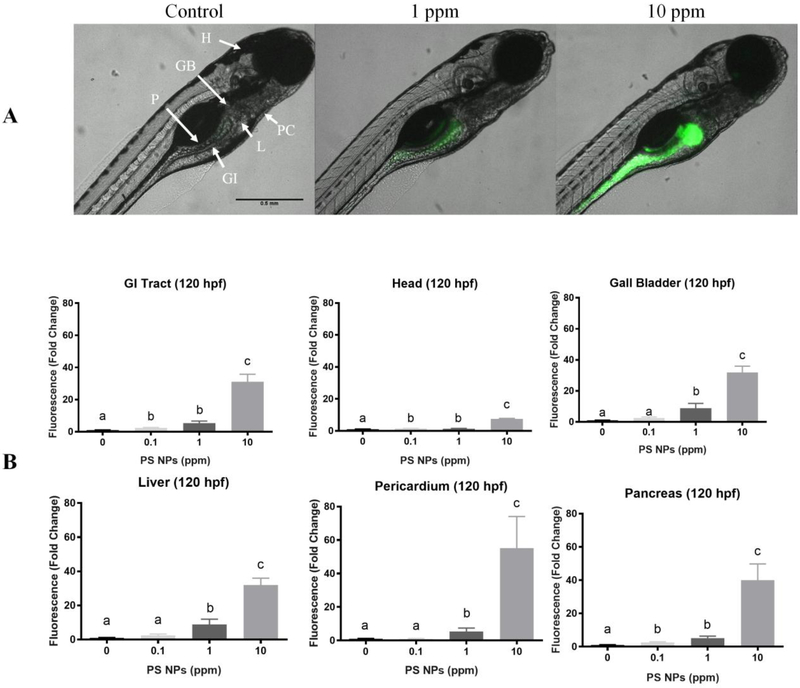
Figure 3. Polystyrene nanoparticles (PS NPs) fluorescence and distribution in 120 hpf zebrafish larvae.
PS NPs fluorescence in zebrafish larvae at 120 hpf (n=5). (A) Fluorescence in the zebrafish larvae. The letters in the control image correspond to the various organs analyzed: (H) head, (GB) gall bladder, (P) pancreas, (PC) pericardium, (L) liver, (GI) gastrointestinal tract. (B) Fluorescence in the gastrointestinal tract, head, gall bladder, liver, pericardial area, and pancreas of zebrafish larvae presented as fold change (means ± SEM). Significance was accepted if p<0.05. Different letters denote statistical differences across treatments.

