Figure 4.

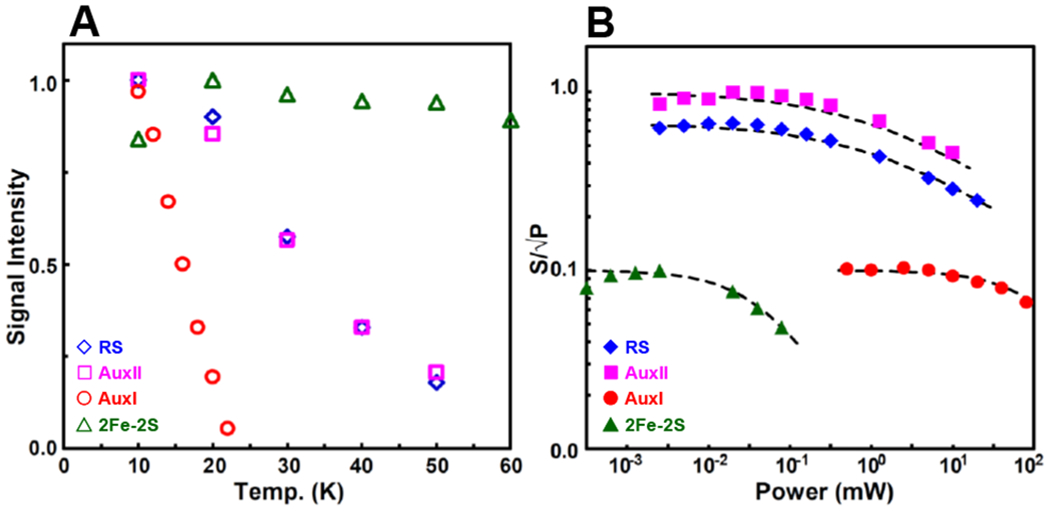
Temperature dependence (A) and power dependence (B) of the EPR signals corresponding to the four Fe–S clusters that are investigated in this work.
For the temperature dependence (A), the RS cluster (blue diamonds) signal intensities are taken from the varying peak amplitudes at the g1 2.040 position in the spectra of dithionite-reduced RS-only variant, shown in Figure S1. The AuxII cluster (magenta squares) signal intensities are taken from the peak amplitudes at the g1 2.059 position in the spectra of dithionite-reduced AuxI/AuxII, shown in Figure S2. The AuxI [4Fe–4S]+ cluster (red circles) signal intensities are taken from the peak amplitudes at the g1 2.104 position in the spectra of Ti(III) citrate-reduced WT sample, shown in Figure S10. The [2Fe–2S]+ cluster (green triangles) signal intensities are taken from the peak amplitudes at the g1 2.004 position in the spectra of dithionite-reduced RS/AuxI, shown in Figure S13.
The power dependence experiment was conducted at 10 K (B). The signal intensity at varying microwave power divided by the square root of the microwave power is plotted vs power. Data points are fit to power saturation curves (dash lines) based on the equation of by using P1/2 = 1.0 mW and b =1.22 for the RS cluster, P1/2 = 1.1 mW and b = 1.22 for the AuxII cluster, P1/2 = 100 mW and b = 1.22 for the AuxI [4Fe–4S]+ cluster and P1/2 = 0.04 mW and b = 1.34 for [2Fe–2S]+ cluster, where P1/2 is the half-saturation power and b is the “inhomogeneity parameter” varying from 1.0 for the inhomogeneous system to 2.0 for the homogeneous system.41
