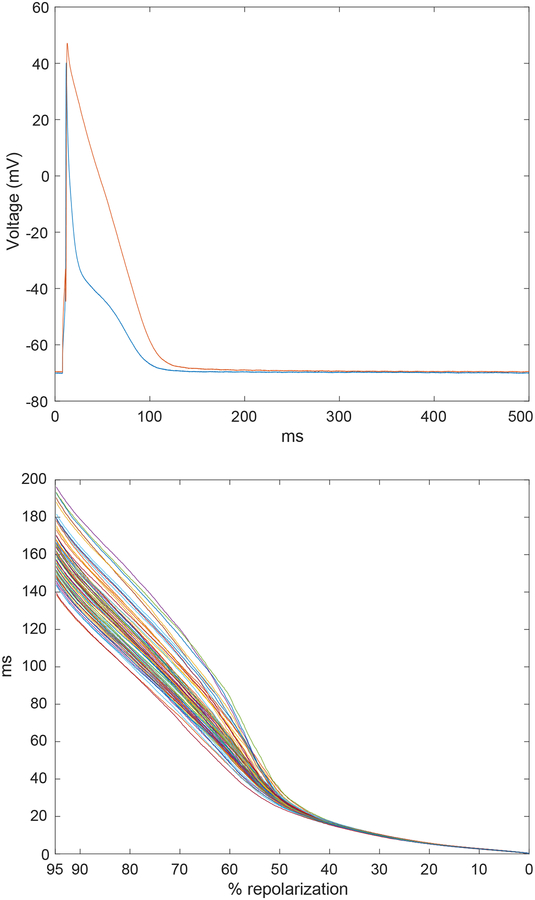
Fig. 1:
Upper panel: Representative APs recorded in cardiomyocytes isolated from CTRL (blue traces) and STZ (red traces) mice. Lower panel: Representation of superimposed inverted AP signals following computation of the inverse function for a train of APs obtained from a STZ myocyte. AP duration (y axis) is presented as a function of membrane voltage, expressed in percentage of repolarization (x axis).

