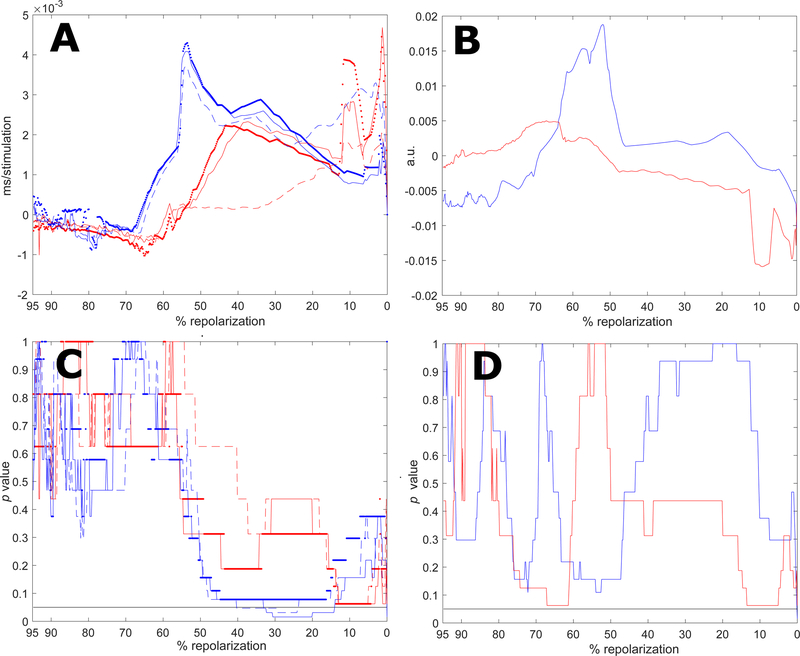
Fig. 11:
A: Median value of the signed rank test for APTDIR index computed throughout the entire repolarization using raw data (dotted lines), linear regression (dashed lines), and 5th-order polynomial approximation (solid lines) for MAPs obtained in CTRL (blue traces) and STZ (red traces) hearts. B: Median value of the signed rank test for APTESVD computed throughout the entire repolarization for CTRL (blue traces) and STZ (red traces) hearts. C: p value of signed rank test for APTDIR index computed using raw data (dotted lines), linear regression (dashed lines), and 5th-order polynomial approximation (solid lines) for CTRL (blue traces) and STZ (red traces) hearts. D: p value of signed rank for APTESVD for CTRL (blue trace) and the STZ (red trace) groups. Black horizontal line is in correspondence of p=0.05.

