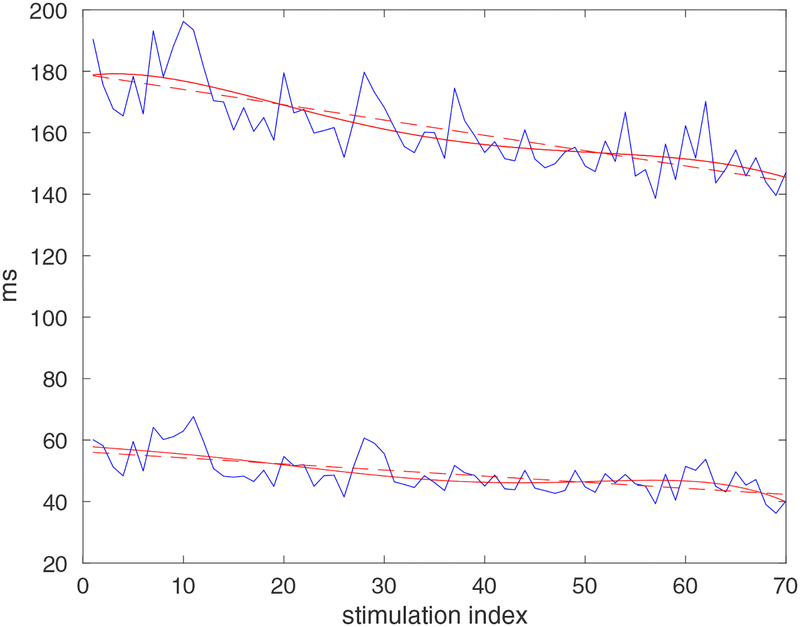
Fig. 4:
Examples of approximations of the AP profile from a STZ mouse cardiomyocyte estimated through the direct approach at fixed levels of repolarization (upper traces: 95% of repolarization; lower traces: 55% of repolarization). Blue lines, dashed red lines and solid red lines correspond to the raw data, linear regression and 5th-order polynomial approximation, respectively.

