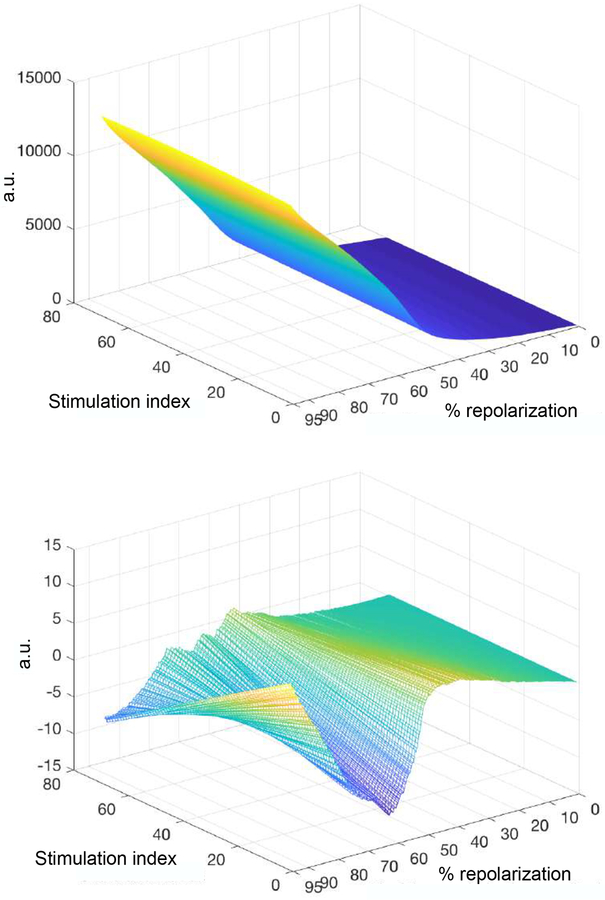
Fig. 7:
Upper panel: Representative example of approximation of the AP profile for a STZ myocyte during the course of stimulation (stimulation index) through dimensionless multiplicative polynomials calculated by ESVD method. a.u.: arbitrary units. Lower panel: Plot illustrating first-order derivatives.

