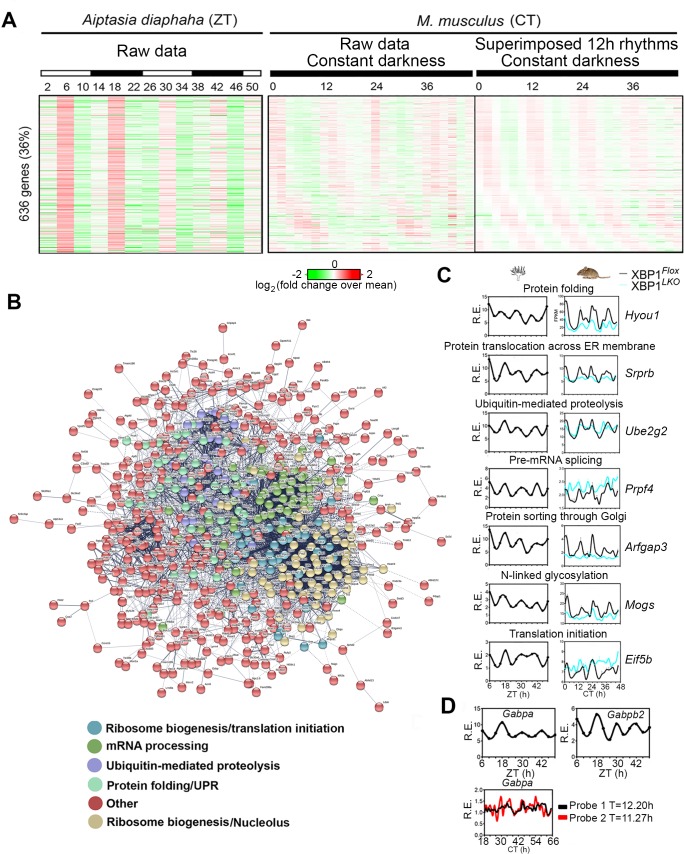
Fig 7. The 12-h rhythms of CEDIF gene expression are evolutionarily conserved in circatidal animals.
(A) Heat map of side-by-side comparison of evolutionarily conserved 12-h gene expression in aposymbiotic A. diaphaha [48] and mouse liver, with both raw data and superimposed circatidal rhythms shown for the mouse liver data. (B) Predicted interactive network construction of these conserved 12-h cycling genes using STRING [49]. Genes involved in different biological pathways are colored differently. (C) RNA-Seq data for representative genes in A. diaphaha [48] and XBP1Flox and XBP1LKO mouse liver. Data are graphed as the mean ± SEM (n = 2). (D) Gabpa and Gabpb2 expression in aposymbiotic A. diaphaha [48] (top) and Gabpa expression in mouse liver from the 48-h microarray dataset [2] indicated by 2 different probes. Numerical values are available in S4 Data. A higher-resolution image of panel B is available in S2 Raw images. CEDIF, central dogma information flow; CT, constant time; R.E., relative expression; RNA-Seq, RNA sequencing; STRING, Search Tool for the Retrieval of Interacting Genes/Proteins; UPR, Unfolded Protein Response; XBP1, X-box Binding Protein 1; ZT, Zeitgeber time.

