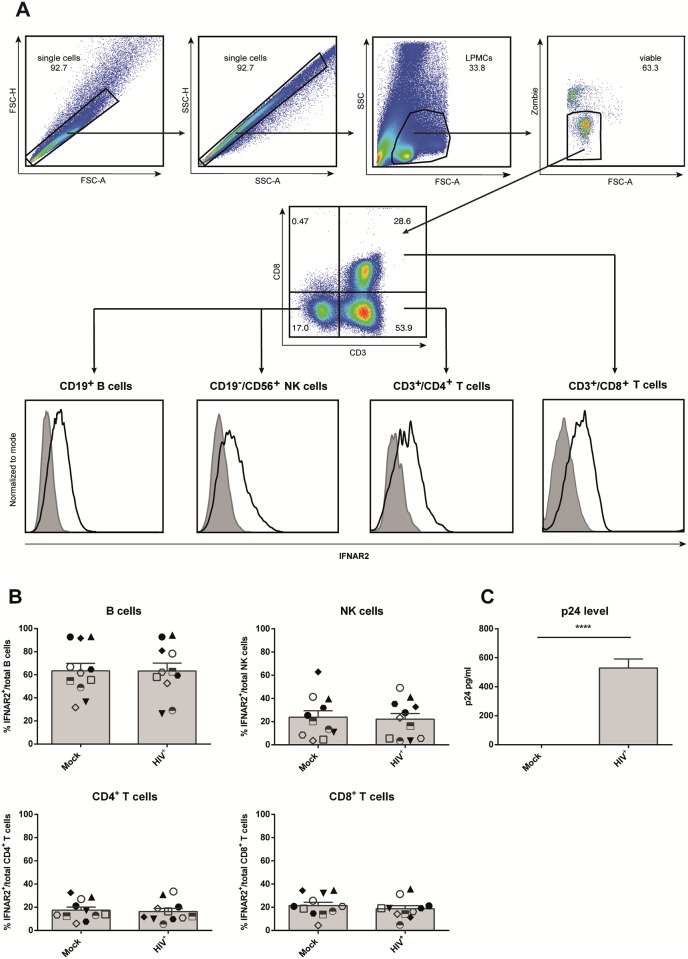
Fig 1. IFNAR2 expression following HIV-1 infection of LPMCs.
LPMCs from healthy donors were infected with R5-tropic HIV-1NL4.3 and cultivated for 4 days. (A) Surface expression of IFNAR2 (black line) on mock-treated and infected cells was determined via flow cytometry on CD4+ T cells, CD8+ T cells, B cells and NK cells using fluorescence minus one controls (tinted area). Histograms and dot plots of one representative LPMC sample are shown. (B) Individual frequencies of IFNAR2-expressing cells and mean values (+SEM) are shown as dots and bars (n = 11). Differences between the groups were analyzed by paired student’s t-test. (C) P24 expression of mock-treated and HIV-infected samples was analyzed by ELISA, p24 expression and mean values (+SEM) are shown by bars (n = 8). Differences between the groups were analyzed by paired student’s t-test, **** indicates p<0.0001.

