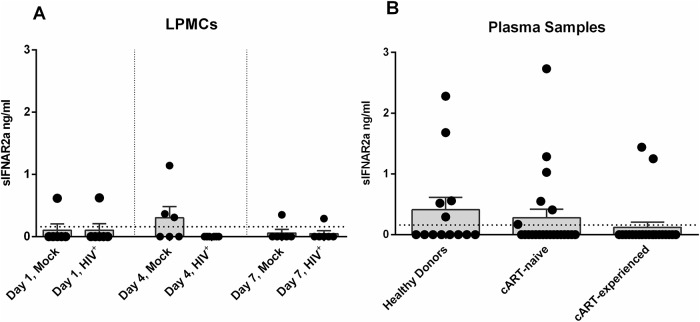
Fig 2. Soluble IFNAR2a expression in HIV-1-infected LPMCs and plasma samples.
Supernatant of mock-treated and R5-tropic HIV-1NL4.3-infected LPMCs from days 1, 4 and 7 post infection (A, n = 6) and plasma samples (B) from healthy donors (n = 13), cART-naïve (n = 22) and cART-experienced HIV-1+ patients (n = 22) were analyzed for sIFNAR2a expression via ELISA. The dotted line indicates the detection limit of 0.16 ng/ml. Individual frequencies of sIFNAR2a-expressing samples and mean values (+SEM) are shown as dots and bars. Statistically significant differences between the groups were analyzed by paired student‘s t-test (LPMCs) and ordinary one way ANOVA analysis with Bonferroni’s multiple comparison (plasma samples).

