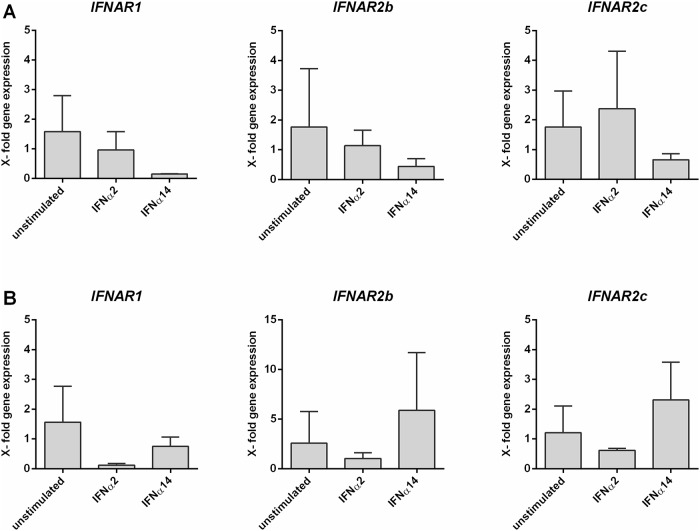
Fig 6. IFNAR1 and IFNAR2 mRNA expression in IFNα subtype-stimulated cells.
After isolation of CD4+ T cells from LPMCs, cells were stimulated with the EC50 of IFNα1, IFNα2, IFNα8 and IFNα14 for 30 min (A) and 24 h (B). Following mRNA isolation and reverse transcription, transcription levels of IFNAR1, IFNAR2b and IFNAR2c were analyzed via qRT-PCR. Quantification of the target mRNA was normalized according to the delta-delta Ct (ΔΔCt) method and the expression fold change (2-ΔΔCt) using GAPDH as reference. The mean gene fold expression (+ SEM) of each target is shown in bars (n = 3). Differences between the groups were analyzed by ordinary one way ANOVA analysis and Bonferroni’s multiple comparisons.

