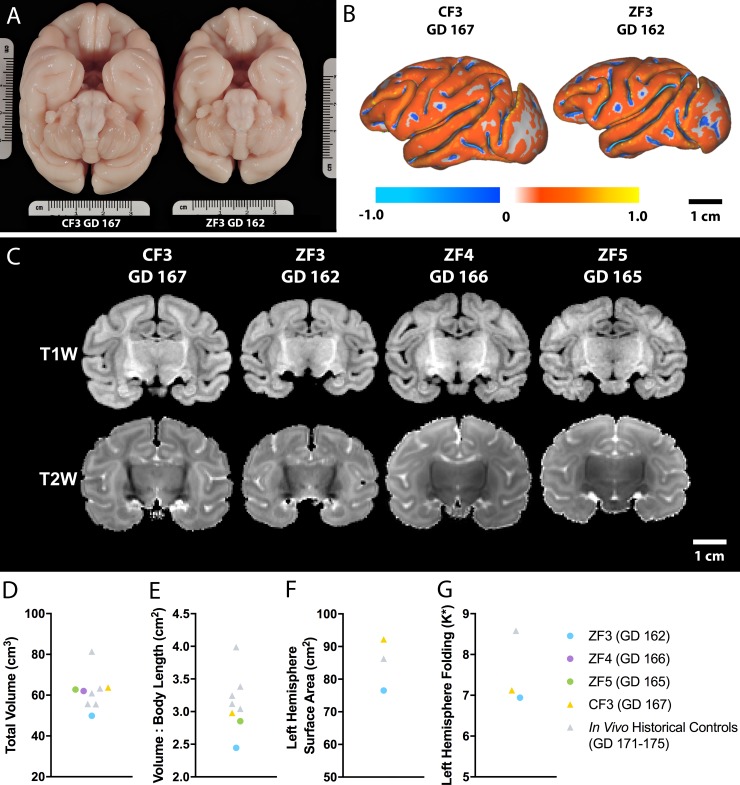
Fig 6. Postmortem MRI analysis of neonatal brains.
(A) An inferior view of the fixed brains of CF3 (left, GD 167) and ZF3 (right, GD 162) shows a grossly smaller brain in the infected animal. (B) Three-dimensional cortical surface models were generated to assess cortical surface area and folding. (C) No lesions or apparent structural abnormalities were detected on T1W or T2W images of CF3 and ZF3-5. (D) Total brain volume was reduced in ZF3 relative to CF3 and in vivo controls [49]. (E) Total brain volume normalized to crown-rump length was also reduced in ZF3. (F) Left hemisphere surface area was reduced in ZF3 relative to CF3 and an in vivo ONPRC historical control. (G) Left hemisphere nondimensionalized mean curvature (K*) as a measure of folding in ZF3 was not appreciably different from CF3.

