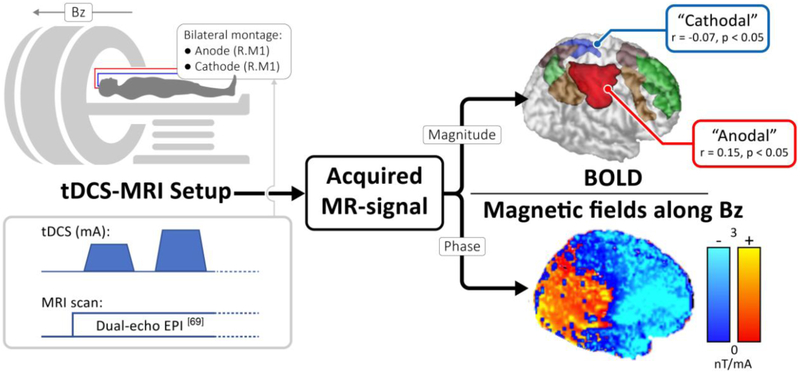
Figure 1. Simultaneous mapping of tDCS electric currents and functional changes in a sample subject.
Concurrent tDCS-MRI data can be acquired as shown, with the phase and magnitude of the MR signal encoding the current induced magnetic field (along Bz) and BOLD-contrast respectively. While the former is linearly proportional to tDCS electric currents along an orthogonal direction (Ampere’s Law), the latter is an established marker for tracking brain activity. An ICA analysis on the BOLD-data identified brain networks including the default mode network (green) and the executive networks (brown). The analysis also identified two regions underneath the anode and cathode electrodes (labelled "anodal" and "cathodal"), which were found to correlate significantly with the applied tDCS current.

