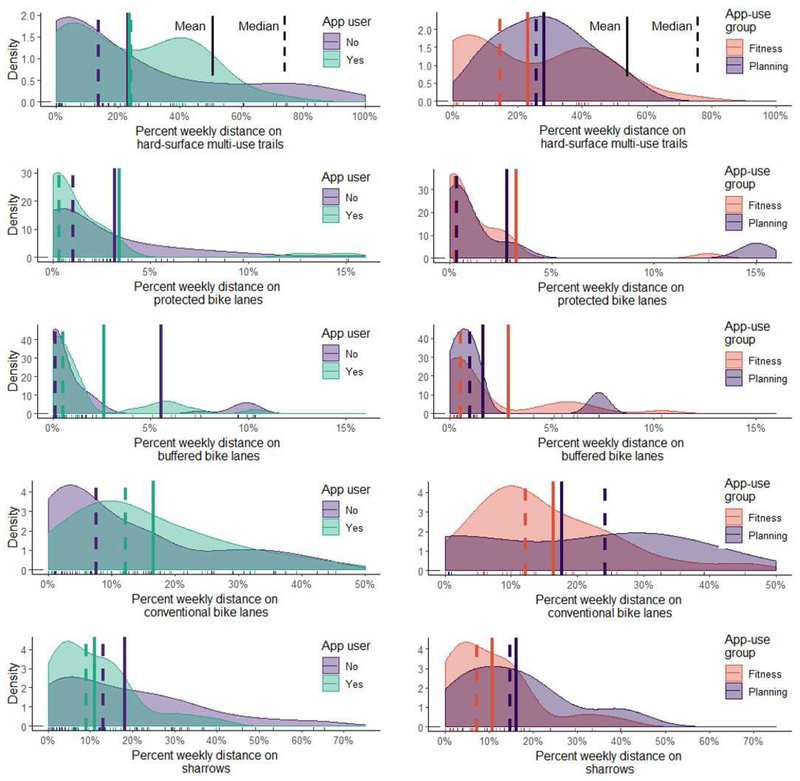
Figure 2.
Comparing the percent of weekly distance ridden on multi-use trails, protected bike lanes, buffered bike lanes, conventional bike lanes, and shared-travel lanes (sharrows) between cyclists who used any app (n=37), those who did not (n=58), those who used a fitness app (n=31), and those who used a planning app (n=9) in a sample of 95 cyclists from Atlanta, GA, USA. Three cyclists used both fitness apps and planning apps. Note: the values of some cyclists are above the x-axis limit: protected bike lanes (app-users=2, non-users=2, fitness-app users=2); buffered bike lanes (app-users=1, non-users=4, fitness-app users=1); conventional bike lanes (app-users=1, non-users=4, 1 fitness-app user).

