
Figure 4.
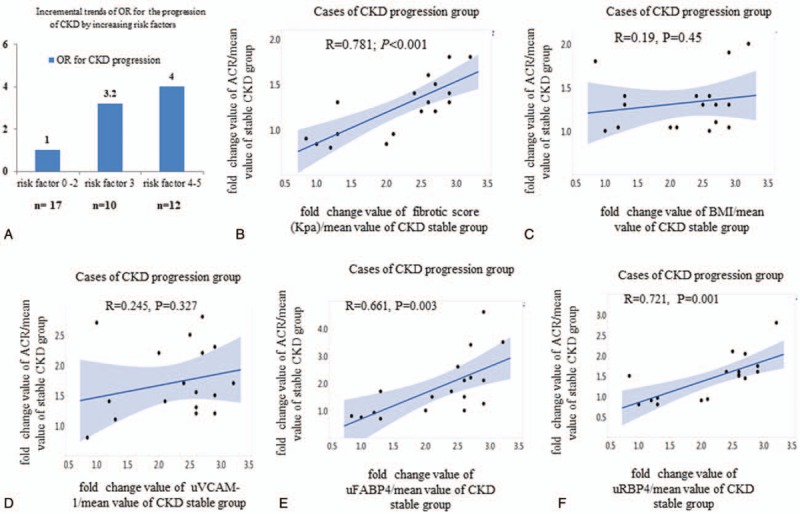
Synergetic effects of significant risk biomarkers for prediction of the CKD progression in severe NAFLD patients with HTN and proteinuria. (A) the relative risks of 0–2, 3, 4-5 risk biomarkers for prediction of CKD progression or CKD stable; (B) correlation between average fold change values of albuminuria and average fold changes of fibrotic score (KPa); (C) correlation between average fold change values of albuminuria and BMI; (D) correlation between average fold change values of albuminuria and uVCAM-1; (E) correlation between average fold change values of albuminuria and uFABP4; (F) correlation between average fold change values of albuminuria and uRBP4. Fold changes were calculated by divided the value of each risk factor in CKD progression group by the mean value of CKD stable group.