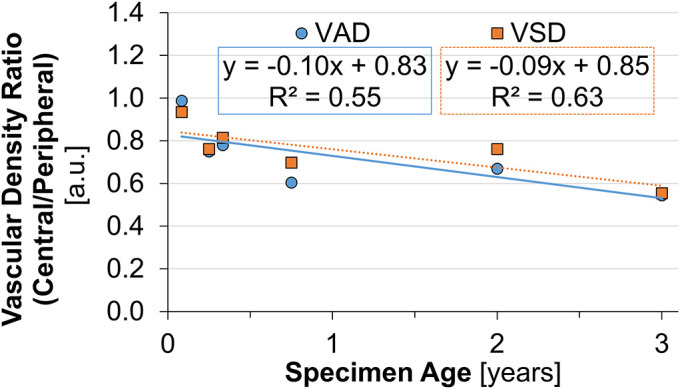
Fig. 7.

Vascular density compared with specimen age. Quantitative vascular density measurements (displayed as a ratio of the central vascular network to the peripheral vascular network) for the selected 6 specimens containing a central vascular network (<3 years of age). A linear fit showed a decreasing trend in the central and peripheral vascular area density (VAD) and vascular skeletal density (VSD) ratios with specimen age up to 3 years. a.u. = arbitrary units.
