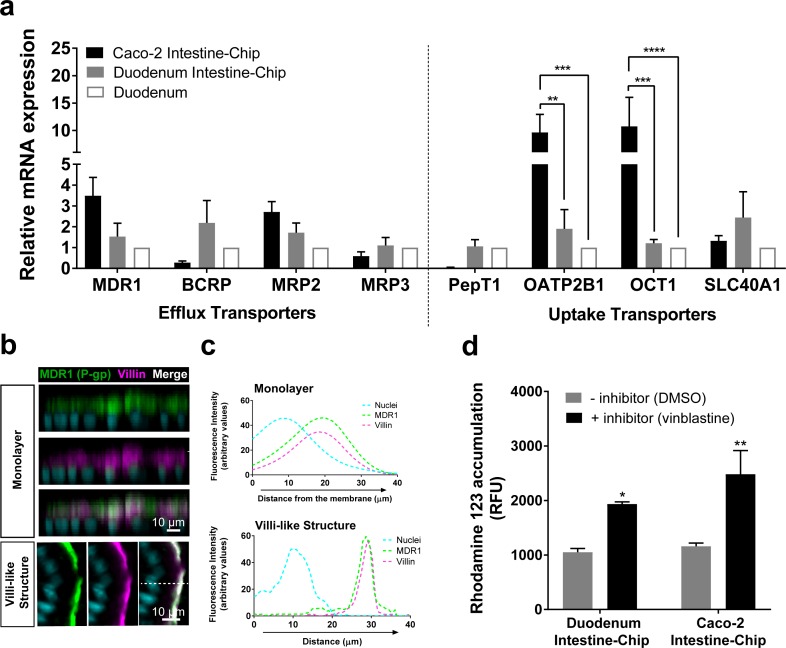
Figure 4. Duodenum Intestine-Chip shows the presence of major intestinal drug transporters and correct localization and function of efflux pump MDR1 (P–gp).
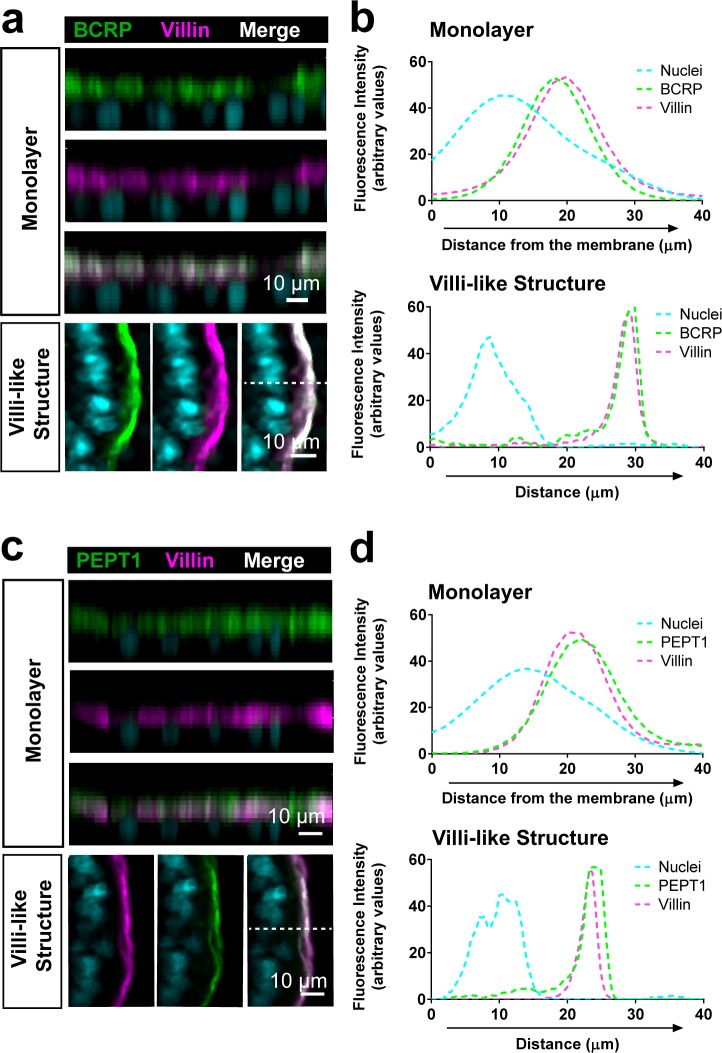
(a) Comparison of the relative average gene expression levels of drug efflux (MDR1, BCRP, MRP2, MRP3) and uptake (PEPT1, OATP2B1, OCT1, SLC40A1) transporters in Caco-2 Intestine-Chip, Duodenum Intestine-Chip, both assessed on day 8 of culture, and RNA isolated directly from the duodenal tissue (Duodenum). The results show that Duodenum Intestine-Chip expresses drug transport proteins at the levels close to human duodenal tissue. Note, the expression of OATP2B1 and OCT1 in Caco-2 Intestine-Chip were significantly higher than in human duodenum while the difference between Duodenum Intestine-Chip and adult duodenum is not significant. Each value represents average gene expression ± s.e.m (error bars) from three independent experiments, each involving Duodenum Intestine-Chip established from a tissue of three different donors (three chips/donor), RNA tissue from three independent biological specimens, and Caco-2 Intestine-Chip (three chips). Values are shown relative to the duodenal tissue expressed as 1, two-way ANOVA, ****p<0.0001, ***p<0.001, **p<0.01. EPCAM expression was used as normalizing control. (b) Representative confocal immunofluorescence micrographs showing apical localization of the efflux transporter MDR1 (green) and the cell surface marker villin (magenta) in a vertical cross section of monolayer (top) formed in Duodenum Intestine-Chip at day 4 and later formed villi-like structure (bottom) at day 8. Cell nuclei are visualized in cyan. Scale bar, 10 µm. (c) Line plots corresponding to confocal images in (b) showing the distribution of fluorescent intensities for three different channels: MDR1 (green), villin (magenta) and nuclei (cyan) along the basal–apical axis of enterocytes forming a monolayer or villi-like structures in Duodenum Intestine-Chip. The fluorescent intensity was analyzed in 3D reconstructed confocal images of Duodenum Intestine-Chip and plotted as average across 20 different z-stacks. Distribution of MDR1 and villin shows significant overlap. See also Figure 4—figure supplement 1 showing luminal localization of additional efflux (BCRP) and uptake (PEPT1) transporters in Duodenum Intestine-Chip. (d) Activity of efflux pump proteins in Caco-2 and Duodenum Intestine-Chip. The intracellular accumulation of the fluorescent substrate of MDR1 - Rhodamine 123 is significantly increased in response to the MDR1 inhibitor vinblastine (black bars) in comparison to vehicle (DMSO) control (gray bars) in Caco2 and Duodenum Intestine-Chip. Data were represented as mean ± s.e.m (error bars) of at least three independent experiments involving chips generated from organoids of three individual donors or Caco-2 cells, all assessed 8 days post-seeding. Two-way ANOVA, **p<0.01, *p<0.05.


