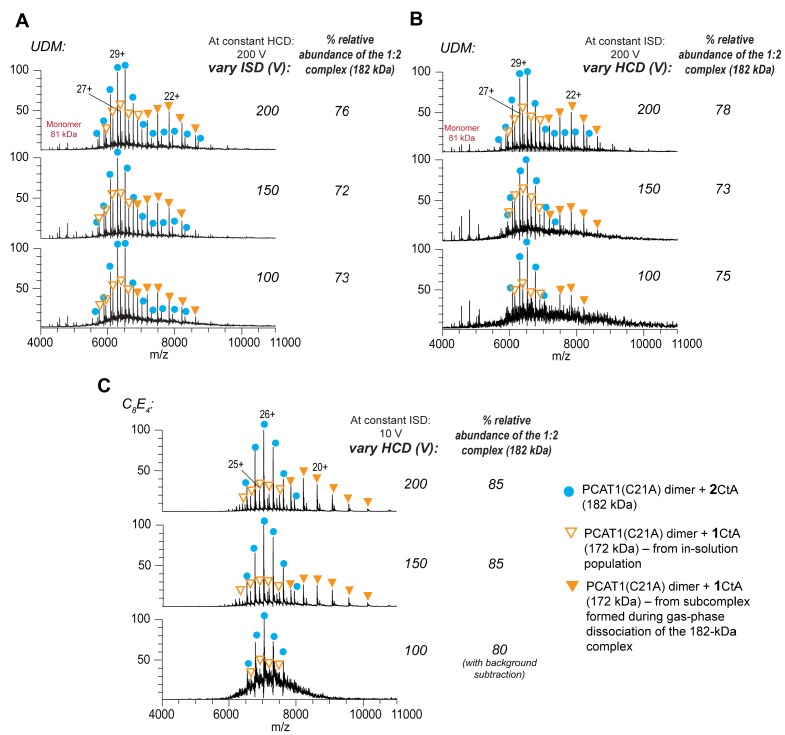
Native MS spectra for PCAT1(C21A) with CtA in UDM with variable (A) ISD at constant HCD of 200 V, (B) HCD at constant ISD of 200 V, and (C) HCD at constant ISD of 10 V for samples in C8E4. The predominant peak series in all the spectra has a mass of 182 kDa (blue filled circles) corresponding to the PCAT(C21A) dimer + 2 CtA complex (1:2 complex). Note that most spectra had well-resolved, near-baseline spectra at various activation energy settings due to the removal of the detergent background. However, these parameters also led to gas-phase activation of the 182 kDa complex and subsequent ejection of one of the bound CtA yielding a charge-stripped subcomplex (172 kDa, PCAT(C21) dimer + 1 CtA complex). Hence, the charge-state series for the 172 kDa complex exhibits a bimodal distribution. The subgroup with higher charge states corresponds to a population that is present in-solution (hollow triangles) and another subgroup with lower charge states (filled triangles) corresponds to the population from gas-phase dissociation of the 182 kDa complex. To estimate the relative abundance of the 1:2 complex in the sample, the peak intensities for the 182 kDa complex and from the charge-stripped 172 kDa subcomplex (at z = 20+ to 24+ for UDM and z = 18+ to 22+ for C8E4) were combined and divided by the total peak intensities for all of the PCAT1 assemblies within each MS spectrum. The ionization and transmission efficiencies as well as MS response factors for the observed PCAT1 complexes might differ. Overall, the calculated relative abundance for the 182 kDa complex remained consistent for all samples within each detergent type at the activation energies that were tested. The lower abundance of the 182 kDa complex in UDM relative to C8E4 is mainly due to the higher collision activation energy settings required to remove the UDM detergent from the complex (i.e., 100–200 V ISD in UDM versus 10 V ISD in C8E4). When indicated, background subtraction was performed using the UniDec software with curved background and smoothing correction.


