. 2020 Jan 14;9:e51492. doi: 10.7554/eLife.51492

Figure 2. The cryo-EM structure of PCAT1-CtA complex.

(A) Cartoon illustration depicting domain organization of PCAT1 and its substrate, CtA. The symbol GG denotes the double glycine motif. The dotted line represents the unstructured cargo region. (B) Two orthogonal views of the PCAT1-CtA complex structure, the leader peptide helix of CtA is shown as a cylinder. The cartoon is color-coded by domains. Blue, CtA; magenta, NBD; yellow, TMD; green, PEP.

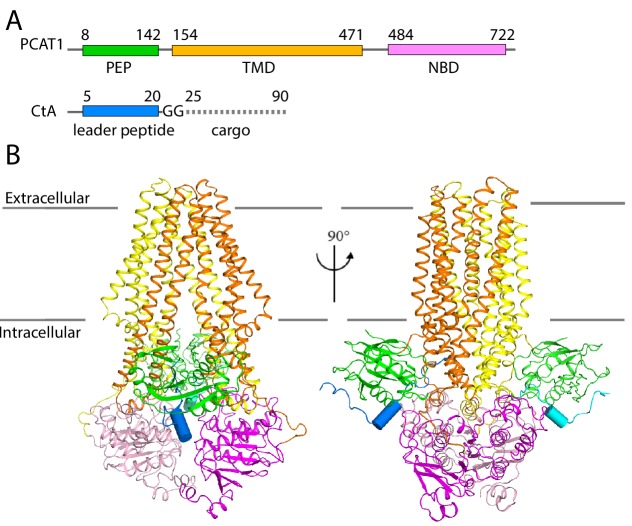
Figure 2.

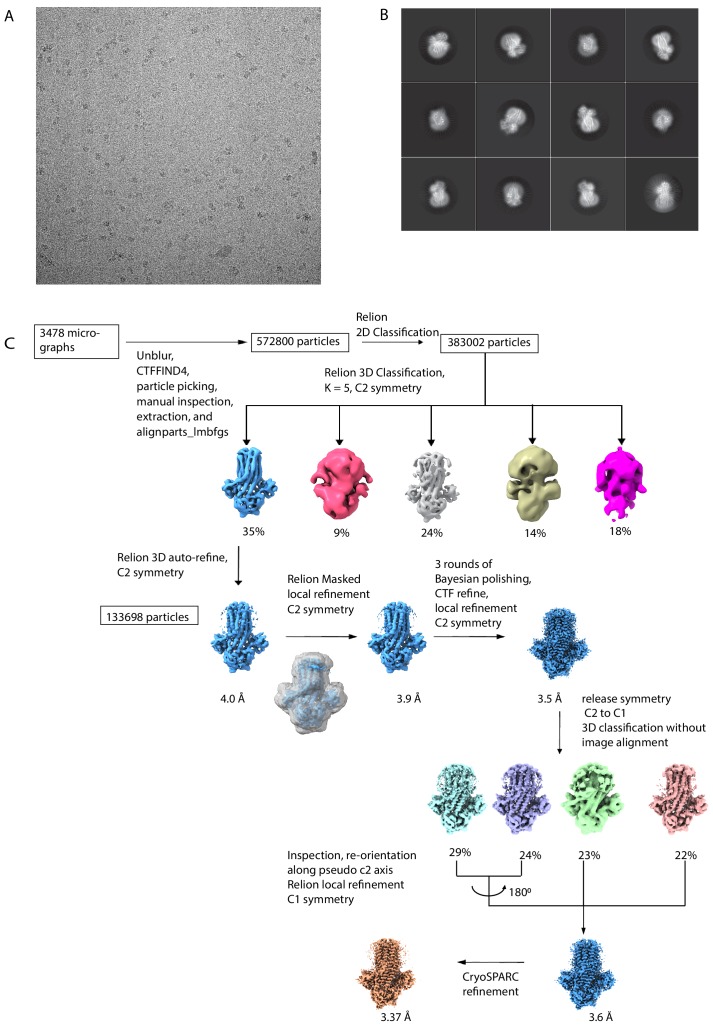
Figure 2—figure supplement 1. Summary of image processing workflow.

Figure 2—figure supplement 1.

(A) A representative cryo-EM micrograph. (B) Representative 2D classes. (C) Flowchart of cryo-EM reconstruction.
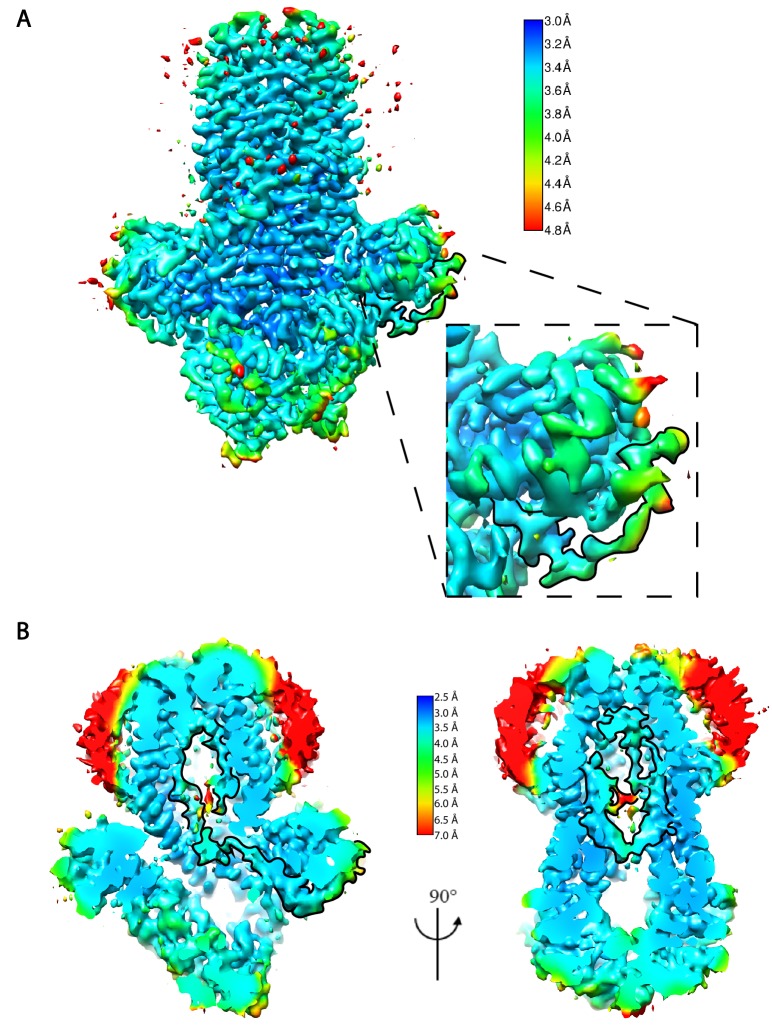
Figure 2—figure supplement 2. Local resolution estimation of the cryo-EM density map.

Figure 2—figure supplement 2.

(A) The local resolution estimation of the sharpened map with a b-factor correction of −100 Å2. The map is contoured at 0.7 in Chimera. The box shows the magnified view of the substrate density highlighted in thick boundary. (B) Two orthogonal views of the unsharpened cryo-EM map shown at a crossed-section through the translocation pathway. The map is contoured at 0.3 in Chimera. The substrate density is highlighted in thick boundary.
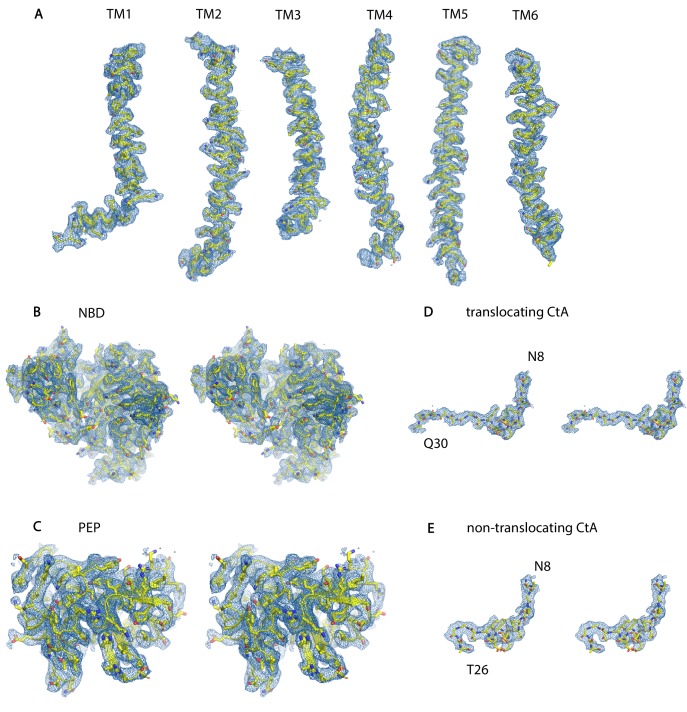
Figure 2—figure supplement 3. The cryo-EM density of different parts of the PCAT1-CtA complex.

Figure 2—figure supplement 3.

Map shown in (A–C) was sharpened with a b-factor correction of −100 Å2, in (D) and (E) was sharpened with a b-factor of −50 Å2. All maps were generated in Chimera with a box size of 300 Å3. (A) TM helices, map contoured at 0.8. (B) Stereoview of the NBDs, map contoured at 0.7. (C) Stereoview of the PEP, map contoured at 0.6. (D–E) Stereoviews of the leader peptides, map contoured at 0.3.
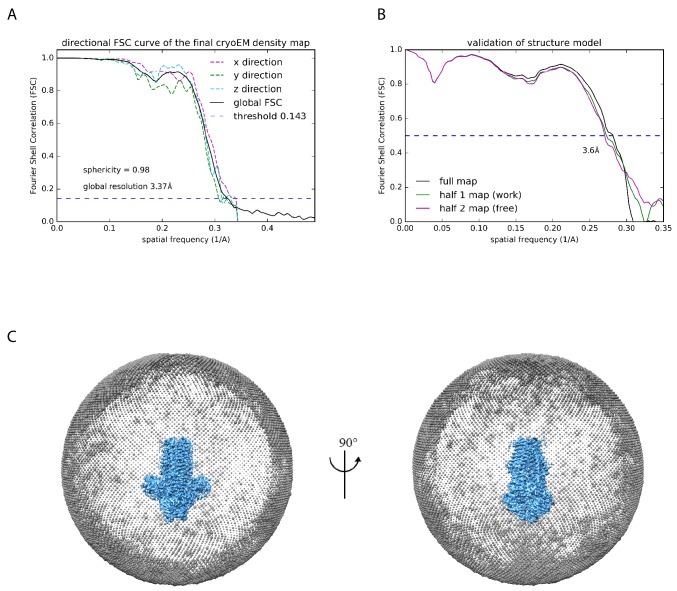
Figure 2—figure supplement 4. Resolution estimation, structure validation, and particle angular distribution.

Figure 2—figure supplement 4.

(A) Anisotropy analysis using the 3D Fourier shell correlation (FSC) plot along with the global resolution estimation (Tan et al., 2017). (B) FSC curves between the refined structure and the half map used for refinement (working, green), the other half map (free, magenta), and the full map (black). (C) Angular distribution plot. Each sphere indicates the particles images oriented in that angle, and the size of the spheres corresponds to the relative number of particles in that angle.