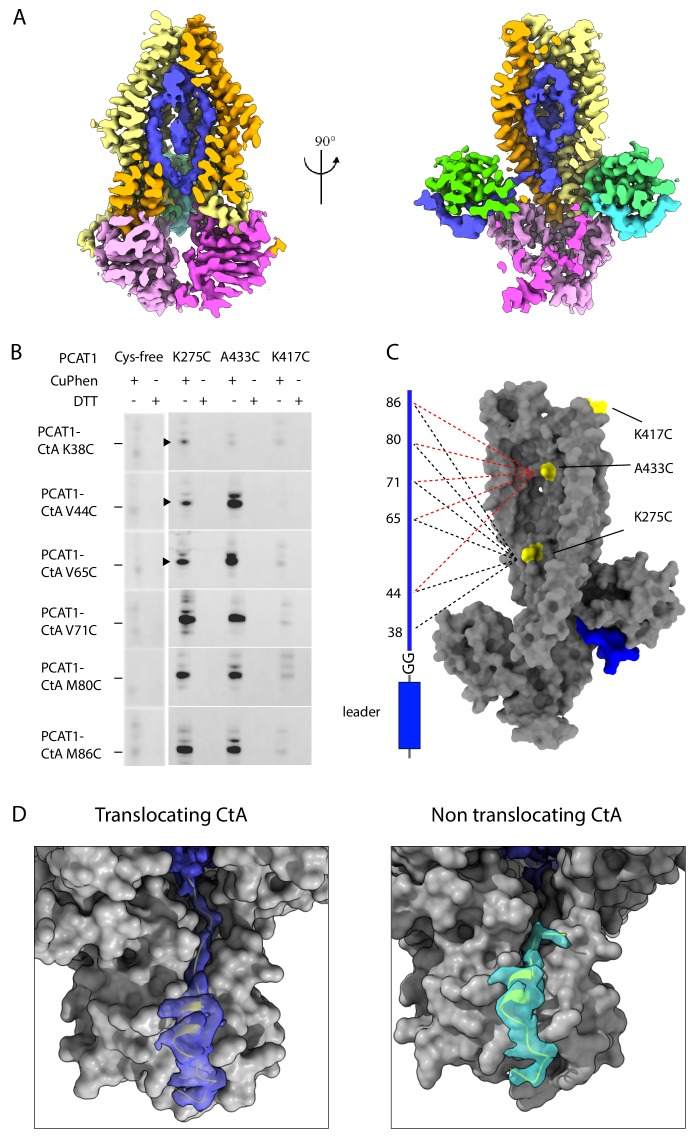
Figure 5. Positions of the two cargos.
(A) Two orthogonal views of the the translocation pathway. A composite cryo-EM map displays PCAT1 density contoured at 0.5 using Chimera, the CtA contoured at 0.24, and the density inside the translocation pathway contoured at 0.15. The cryo-EM density inside the TM cavity (shown in blue) likely corresponds to the C-terminal region of one CtA molecule. (B) Disulfide crosslinking experiments between PCAT1 and CtA. Crosslinked PCAT1-CtA products were detected by Western blot using an anti-HA antibody against HA-tagged CtA. Three bands (indicated by arrows) were excised from the SDS-PAGE and analyzed by mass spectrometry. In all three cases, peptide fragments with the correct disulfide bond were identified. (C) Summary of the crosslinking results. A PCAT1 monomer is shown as grey surface and CtA is represented by a cartoon. The dotted lines illustrate the crosslinked pairs (black, 275C crosslink pairs; red, 433C crosslinked pairs). (D) Comparison of the cryo-EM density at the two catalytic sites. The density is displayed as surface. Dark blue, the translocating CtA; light blue, the non-translocating CtA. The maps were contoured at 0.6 using Chimera. The TMD and PEP are shown as grey surfaces and the NBDs are omitted for clarity. The leader peptides are shown as ribbons.

