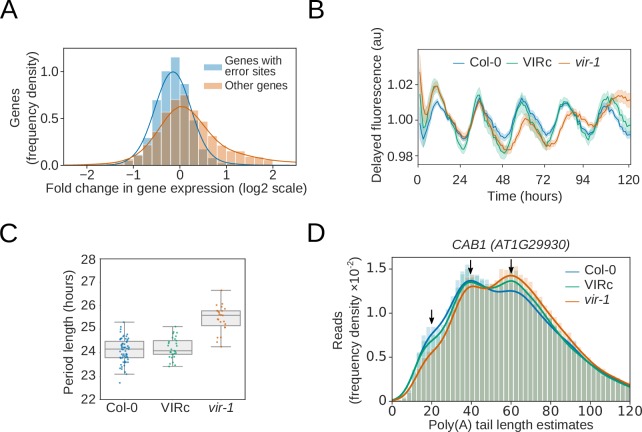
Figure 6. Reduction in m6A RNA modification leads to disruption of the circadian clock.
(A) Genes with differential error rate sites have lower detectable RNA levels. Histogram showing the log2 fold change in protein coding gene expression based on counts from nanopore DRS reads in the vir-1 mutant compared to the VIR-complemented line. Blue, genes with differential error rate sites (n = 5083 genes); orange, genes without differential error rate sites (n = 14,675 genes). (B) The circadian period is lengthened in the vir-1 mutant. Mean delayed fluorescence measurements in arbitrary units: blue, Col-0 (n = 61 technical reps); green, the VIR-complemented line (VIRc; n = 29 technical reps); orange, vir-1 (n = 24 technical reps). Shaded areas show bootstrapped 95% confidence intervals for the mean. (C) Boxplot showing the period lengths calculated from delayed fluorescence measurements shown in (b): blue, Col-0; green, VIRc; orange, vir-1 (orange). (D) Poly(A) tail length is altered in the vir-1 mutant. Histogram showing the poly(A) tail length distribution of CAB1 (AT1G29930): blue, Col-0 (n = 40,841 reads); green, VIRc (n = 65,810 reads); orange, vir-1 (n = 68,068 reads). Arrows indicate phased peaks of poly(A) length at approximately 20, 40 and 60 nt. vir-1 distribution is significantly different from both Col-0 and VIRc, according to the Kolmogorov–Smirnov test (p < 1 × 10⁻¹⁶, p < 1 × 10⁻¹⁶ respectively).


