Figure 6. iMDK-treated and mk mutant regenerating limbs display dysregulated wound epidermis gene expression and persistent inflammation.
(A) Beta-III tubulin staining or WE3 staining of DMSO- or iMDK-treated limbs. White dotted line marks boundary of wound epidermis/AEC-blastema. (B) Heatmap of annotated differentially expressed transcripts in DMSO- and iMDK-treated limbs (N = 3 each) reveals two main clusters (colored pink and orange) of transcripts either enriched in DMSO or iMDK treatments. Transcript expression was normalized per row and plotted as a Z-score. Differentially expressed transcripts can be found in Supplementary file 4. (C) Heatmap of normalized TPM expression levels of wound epidermis genes in DMSO- or iMDK-treated regenerating limbs at 11 dpa. (D) Plot of enriched pathways in iMDK-treated limbs. (E) Plot of enriched pathways in DMSO-treated limbs. (F) Quantification of NSE+ monocytes at 5 dpa in DMSO/iMDK-treated limbs at 5 dpa (N = 7 DMSO, 6 iMDK). (G) Quantification of the density of NSE+ monocytes in mkWT control and mknull regenerating limbs at 10 dpa (N = 7 mkWT, 8 mknull). (H) NSE staining of DMSO- and iMDK-treated limbs at 5 dpa and 14 dpa. Dotted lines demarcate the amputation plane. (I) Representative NSE stained sections from regenerating limbs of mkWT control and mknull mutants at 10 dpa. Higher magnification insets are shown in bottom two panels. Each N represents a limb from a different animal. Data demonstrating rescue of mknull phenotypes via overexpression of mk during regeneration in mutant limbs as well as electroporation efficiency metrics can be found in Figure 6—figure supplements 1, 2 and 3. A two-tailed unpaired student’s t-test was used for statistical analysis. Graphs are mean ± SD. *p<0.05. Scale bars, A (top): 100 µm, A (bottom), H-I (top): 200 µm, I (bottom): 50 µm. bl, blastema, dpa, days post-amputation.

Figure 6—figure supplement 1. Mk overexpression in mknull regenerating limbs rescues delayed regeneration.
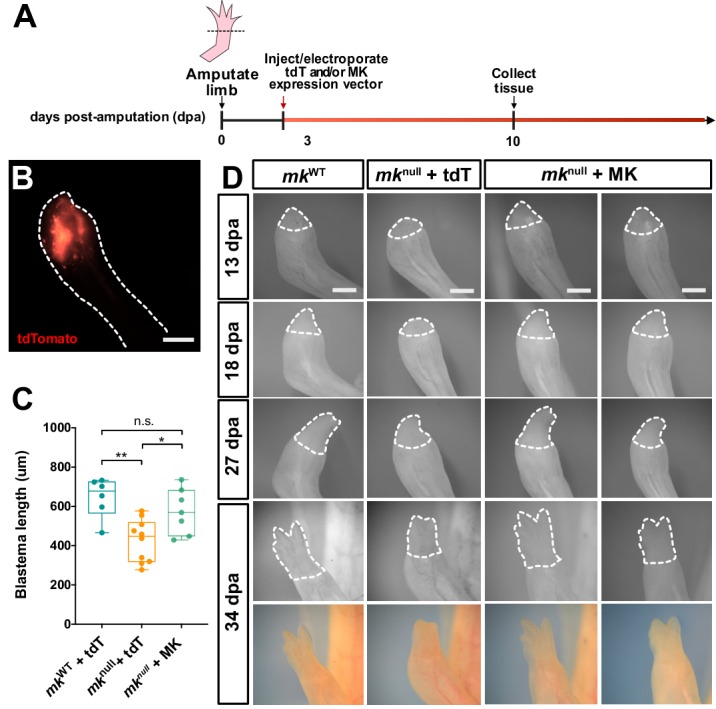
Figure 6—figure supplement 2. Mk overexpression in mknull regenerating limbs rescues mutant wound epidermis and monocyte density phenotypes.

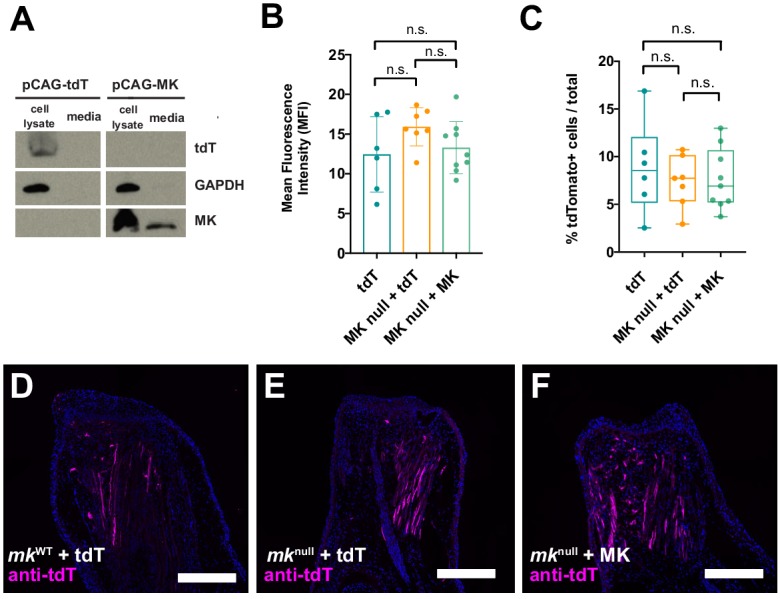
Figure 6—figure supplement 3. Electroporation efficiencies are similar between pCAG-tdTomato and pCAG-MK injected mknull mutant and mkWT regenerating limbs.