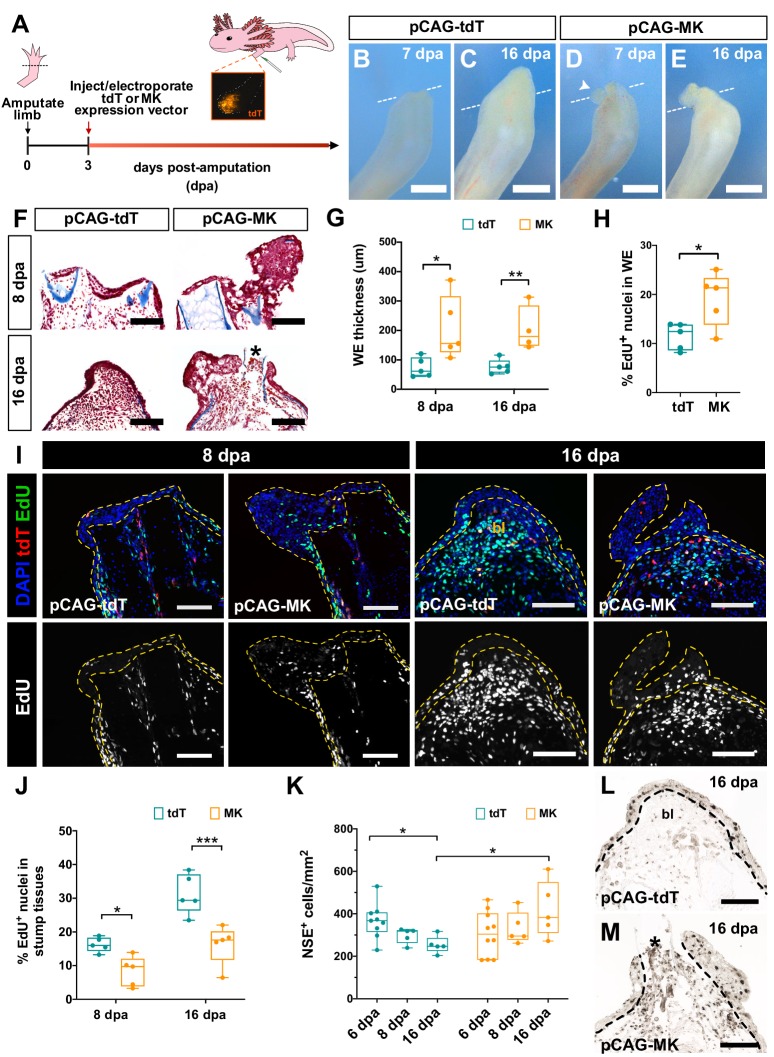
Figure 7. Overexpression of mk in regenerating limbs leads to wound epidermis expansion, decreased blastemal cell proliferation, and improper resolution of inflammation.
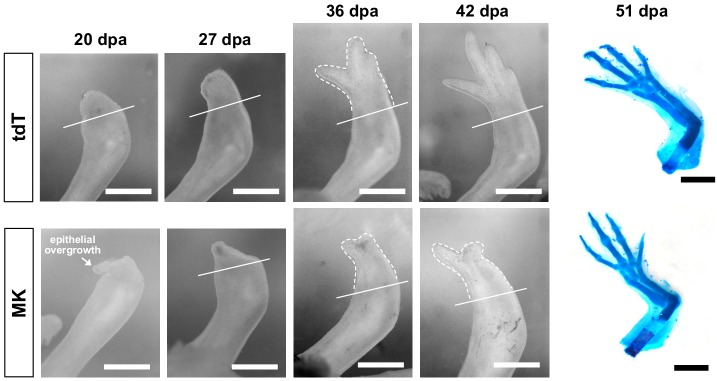
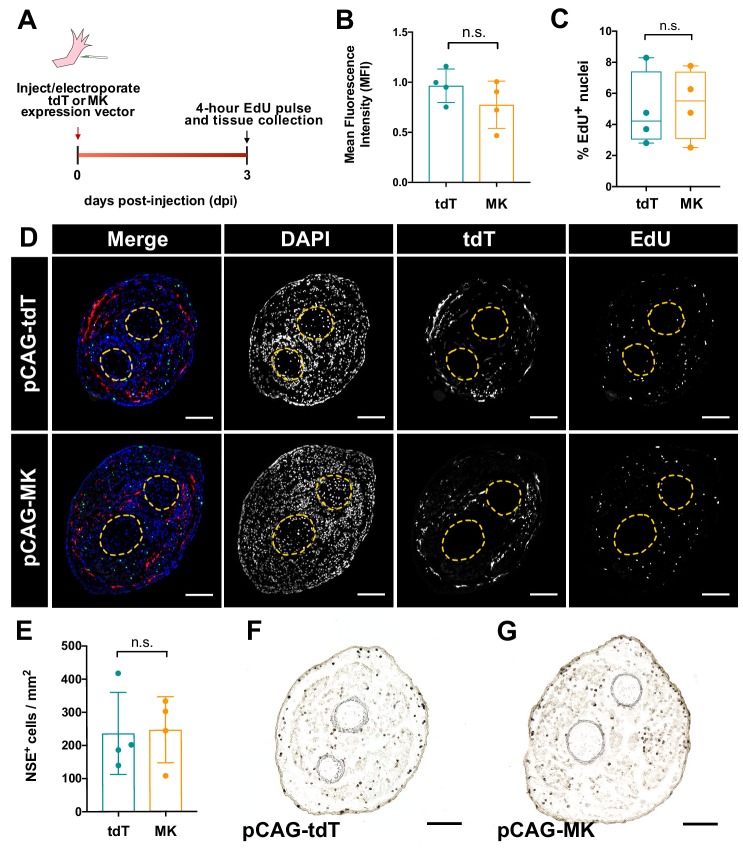
(A) Schematic of mk overexpression experiment. (B–E) Representative brightfield images of tdTomato (tdT)- (B–C) or mk-overexpressing (D–E) regenerating limbs at 7 and 16 dpa. White dotted line denotes amputation planes and white arrowhead in D denotes small aberrant skin growth. (F) Representative picro-mallory stained sections of tdT- or mk-overexpressing regenerating limbs. Asterisk marks protruding bone. (G) Quantification of wound epidermis thickness in tdTomato- or mk-overexpressing limbs at 8 dpa (N = 5 each) and 16 dpa (N = 5 tdT, N = 4 MK). (H) Quantification of the percentage of EdU+ nuclei in the wound epidermis of tdTomato- or mk-overexpressing limbs at 8 dpa (N = 5 each). (I) Representative images of EdU-stained sections of tdTomato- or mk-overexpressing limbs. Wound epidermis/AEC are outlined with yellow dotted lines. (J) Quantification of the percentage of EdU+ nuclei in regenerating stump tissues of tdT- or mk-overexpressing limbs. (K) Quantification of the density of NSE+ monocytes in tdT- or mk-overexpressing limbs. (L–M) Representative images of NSE-stained sections in tdT- or mk-overexpressing limbs. Black dotted line denotes wound epidermis boundary. Asterisk denotes protruding bone. Quantification of EdU+ cells in the wound epidermis and blastemal cells of DMSO/iMDK-treated and WT/mknull regenerating limbs is shown in Figure 7—figure supplement 1. Electroporation efficiency data can be found in Figure 7—figure supplement 2. Data showing that mk-overexpressing regenerating limbs display delayed regeneration is shown in Figure 7—figure supplement 3. Data demonstrating that overexpression of mk in non-regenerating intact limbs does not affect cellular proliferation or monocyte density can be found in Figure 7—figure supplement 4. Graphs are mean ± SD. Two-tailed unpaired student’s t-tests were used for statistical analysis. *p<0.05, **p<0.01, ***p<0.005. Scale bars, B-E: 500 µm, F, I, L-M: 200 µm. bl, blastema, dpa, days post-amputation.
Figure 7—figure supplement 1. Mk is not required for proliferation in the wound epidermis or blastemal cells.
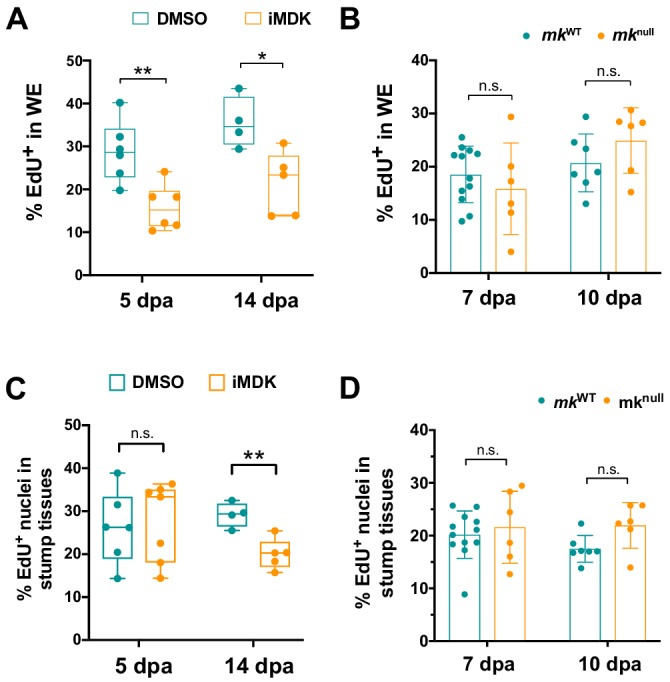
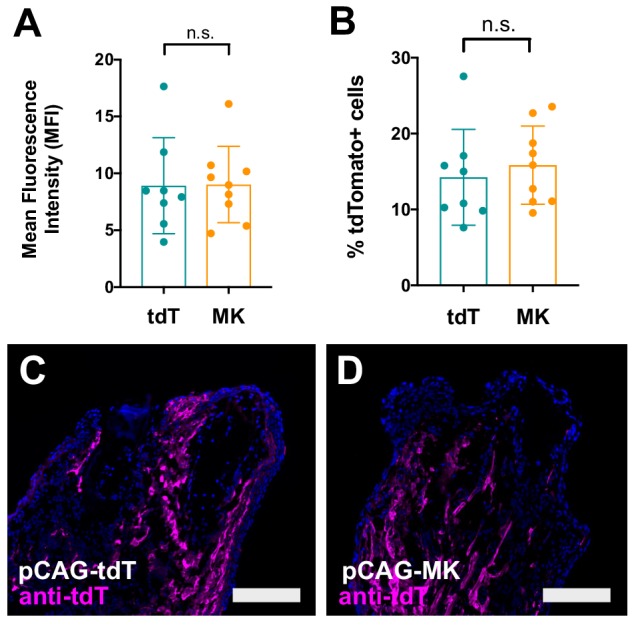
Figure 7—figure supplement 2. Electroporation efficiencies of pCAG-tdT and pCAG-MK injected regenerating limbs are similar.
