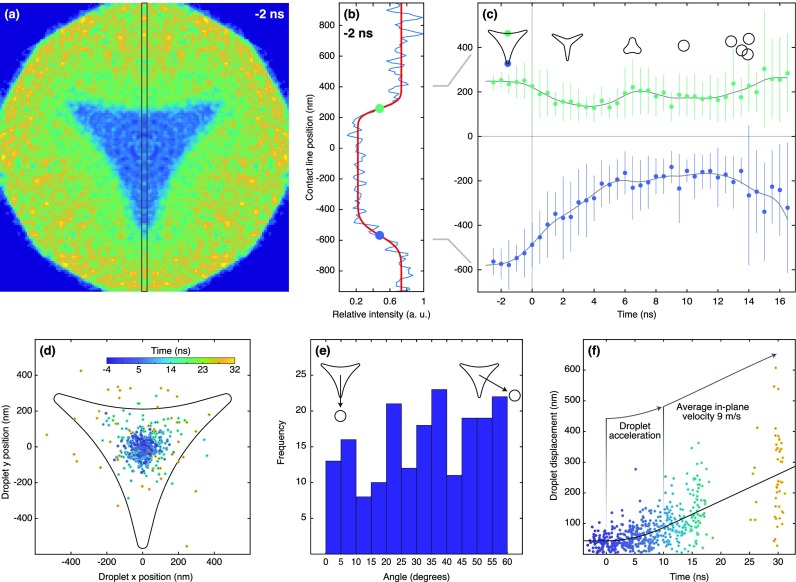
FIG. 3.
Analysis of the jumping nanodroplet dynamics. (a) Ensemble image of the nanoprism 2 ns before flash-melting. (b) Intensity profile (blue line) of the area marked in (a). The center positions of the boundaries (dots) are extracted from a fit (red line). (c) Center positions of the droplet boundaries as a function of time (dots). Vertical lines indicate the standard deviation of the average droplet boundary position (supplementary material Note 1). The gray lines serve as a guide for the eye. (d) Positions of the center of mass of the jumping droplets at different time delays (encoded by the color scale, inset). (e) Angular distribution of the jumping droplets in the time interval of 12–32 ns. (f) The displacements of the center of mass of droplets as a function of time (circles) is fit with a simple model (black line).

