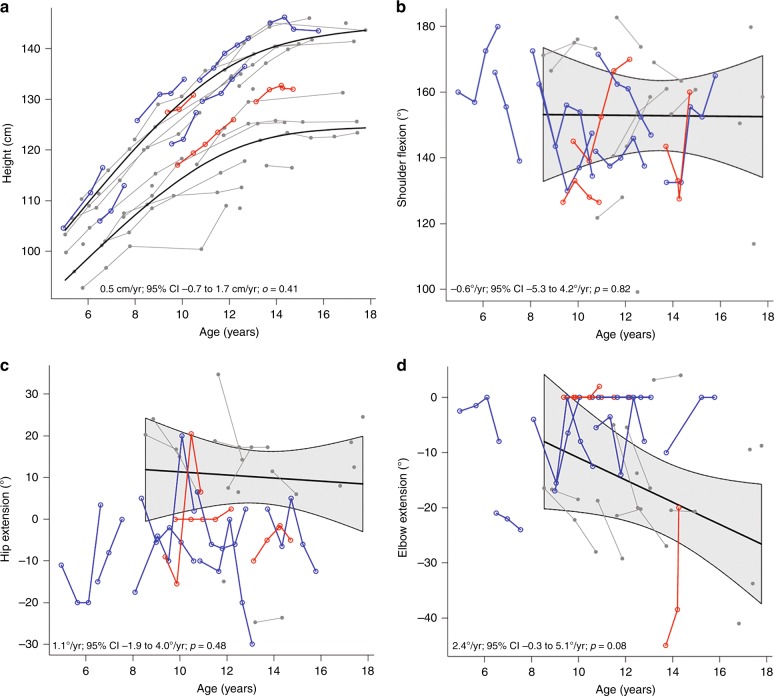
Fig. 1.
Comparison of change in a height and b−d range of motion in treated participants compared to historic MPS IH control data. Blue connected circles indicate participants who did not develop high antidrug antibodies during the study. Red connected squares indicate participants who did develop high antidrug antibodies with neutralizing antibodies during the study. Historic male and female control data are shown in gray and includes linear mean trajectory with 95%CI shown by shaded area

