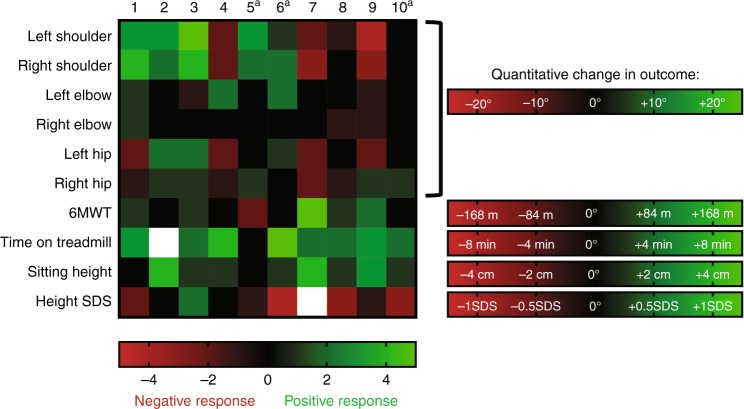
Fig. 3.
Heatmap of outcomes for each individual participant. Green indicates more positive response to treatment, red a more negative response to treatment, and white with X indicates missing data. A “+” indicates that the participant developed high antidrug antibodies with neutralizing antibodies during the study. 6MWT 6-min walk test, TM treadmill, SDS standard deviation score. 6MWT grading based on previously reported change in 6MWT with long-term laronidase treatment33

