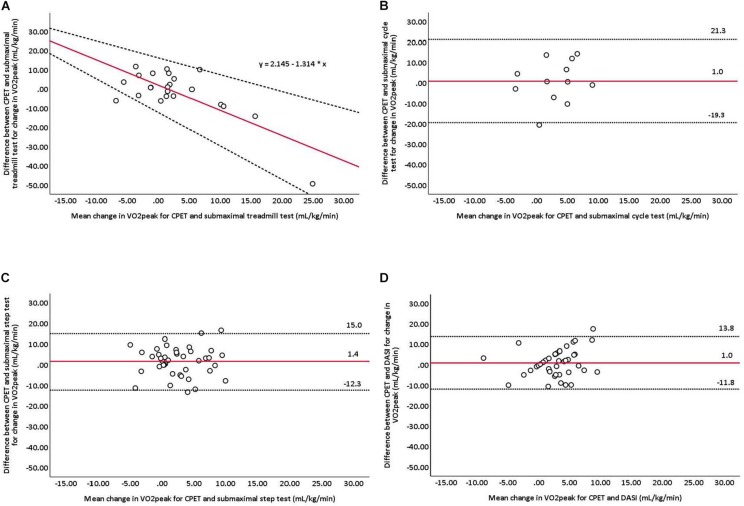
FIGURE 2.
Bland-Altman plots comparing measured and predicted changes in V̇O2peak for (A) Bruce treadmill, (B) Astrand-Ryhming cycle ergometer, and (C) Chester step tests, and (D) DASI. The red line represents mean differences between measured and predicted V̇O2peak. Dashed lines represent the limits of agreement (mean difference ±1.96 standard deviation). CPET, cardiopulmonary exercise testing; DASI, Duke Activity Status Index. A line of best fit is presented for the Bruce treadmill test as proportional bias was detected.

