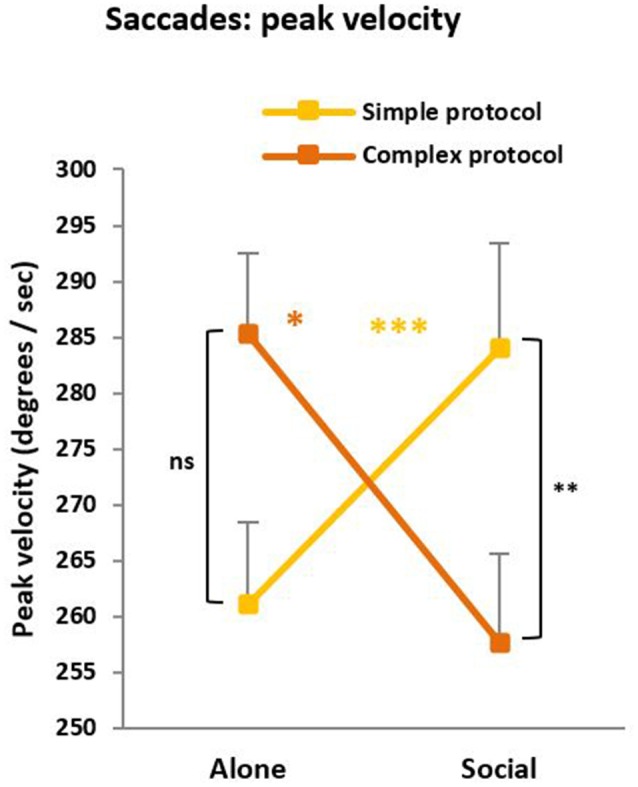
Figure 5.

Peak velocity. Like saccade latency, peak velocity revealed a social influence whose direction depends on the protocol complexity. For the simple protocol, peak velocity was higher under social testing (Social) compared to solitary testing (Alone) suggesting a social facilitation (***p < 0.001). On the opposite, for the complex protocol, peak velocity was lower under social than solitary testing suggesting a social inhibition (*p = 0.04). Note that the difficulty effect (the difference across protocols) reached significance under social (**p = 0.01) but not solitary (nsp = 0.11) testing.
