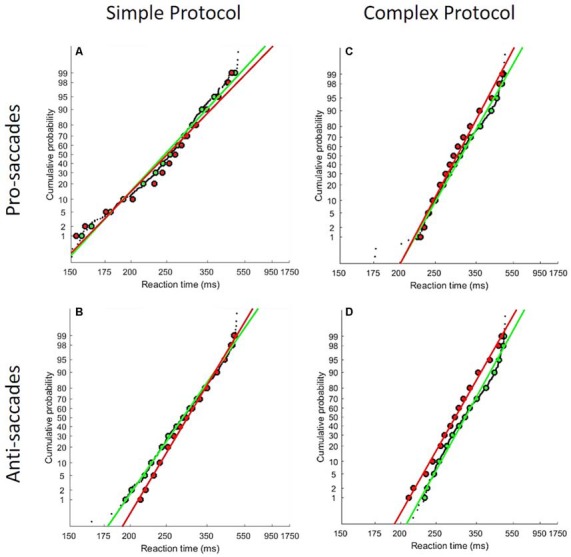
Figure 6.

LATER model results. Reciprobit plots for each saccade protocol [simple (A,B) and complex (C,D)] and for each saccade type [pro (A,C) and anti (B,D)]. The socially tested subjects are showed in green line, and the subjects tested alone are showed in red line. As described in the main text, distributions differ significantly between the two groups of subjects in all four conditions.
