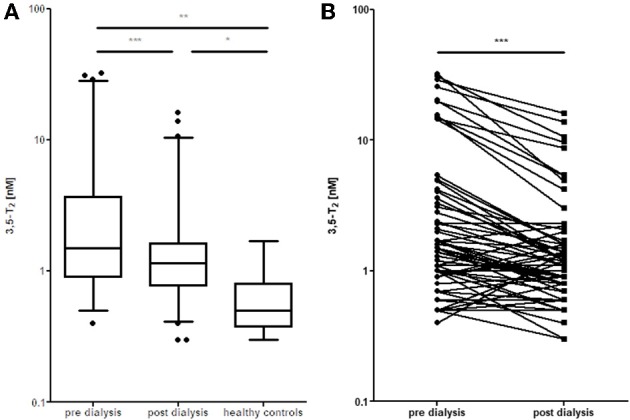
Figure 3.

Elevated 3,5-T2 concentrations in serum of dialysis patients. (A) Decrease in serum 3,5-T2 concentrations after dialysis, but still elevated compared to healthy controls (*p < 0.05; **p < 0.01; ***P < 0.001). (B) Comparison pre vs. post dialysis; paired t-test, Wilcoxon signed rank test (Gaussian approximation) (***P < 0.001) (43).
