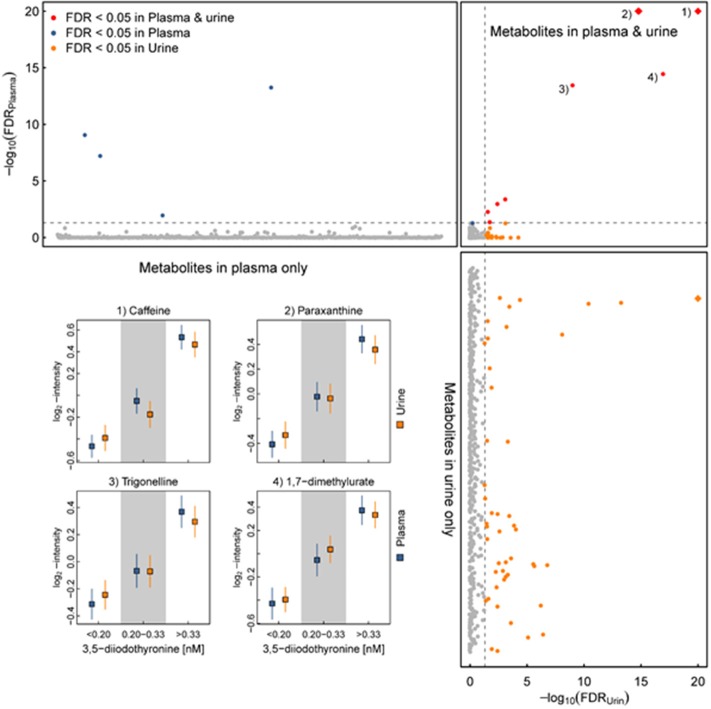
Figure 4.
Serum 3,5-T2 concentration and multifluid (urine and plasma) metabolomics in healthy individuals of the SHIP-Trend cohort. (Upper) P-values (y-axis) for plasma metabolites (x-axis) after correction for multiple testing (false discovery rate—FDR) comparing participants with low serum 3,5-diiodothyronine (3,5-T2) concentrations (<0.20 nM) with participants with high serum 3,5-T2 concentrations (>0.33 nM). Values have been transformed by –log10 to ease visualization of small values. (Upper right) Opposing FDR-values for the same comparison for metabolites measured in plasma (y-axis) and urine (x-axis). (Left) Similar to upper panel but showing the results for metabolites measured in urine only. Darker colors indicate metabolites meeting the threshold for statistical significance (FDR < 0.05) and red indicates metabolites consistently associated in both fluids. Inset: Predicted least-square means with 95%-CIs from linear regression models for four metabolites selected across the three approximately equally-sized groups of participants divided according to serum 3,5-T2 concentrations (44). All p-values were derived from a linear regression model treating serum 3,5-T2 concentrations as categorical exposure and metabolites as outcome, controlling for age, sex, waist circumference as well as serum thyroxine and thyrotropin concentrations. Blue—plasma and orange—urine.

