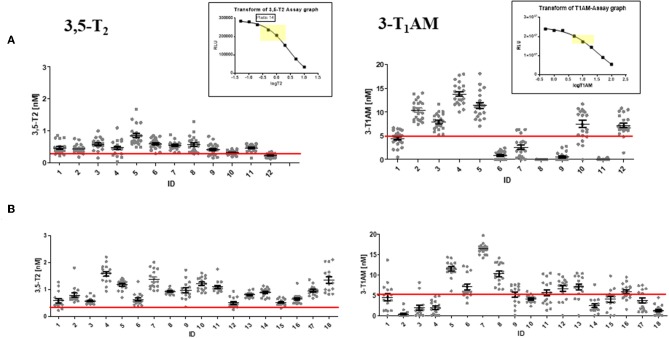
Figure 6.
Remarkably stable individual 3,5-T2 serum concentrations during several hours and days of sampling time but significant inter-individual differences. Graphs show absolute serum concentrations of 3,5-T2 (left) and 3-T1AM (right) for each individual receiving Liothyronine in the two kinetic studies presented in Figures 5A,B. Upper panel (A): 12 euthyroid volunteers with blood drawn over 72 h; lower panel (B): 18 hypothyroid patients with blood drawn over 8 h. Inter-individual differences for 3-T1AM serum concentrations seem to show higher variations than those for 3,5-T2, and variations over time might be more pronounced than those of 3,5-T2. Individual serum concentration data are provided in Supplementary Data Sheet 2. Insets show typical standard curve for 3,5-T2 and 3-T1AM CLIA standard curves, with reference range marked in yellow. The red line represents the preliminary reference concentration for healthy controls.

