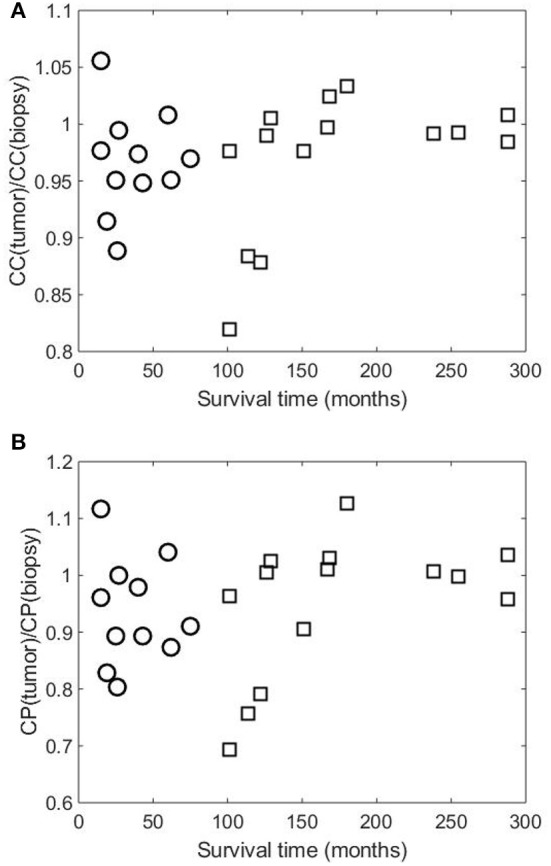
Figure 4.

Scatter plots of survival time of 25 rectal cancer patient against (A) ratios of clustering coefficients of primary tumor [CC(tumor)] to those of biopsy [CC(biopsy)], and (B) ratios of characteristic path lengths of primary tumor [CP(tumor)] to those of biopsy [CP(biopsy)]. Symbols “○” and “□” indicate patient groups with shorter and longer times of survival, respectively.
