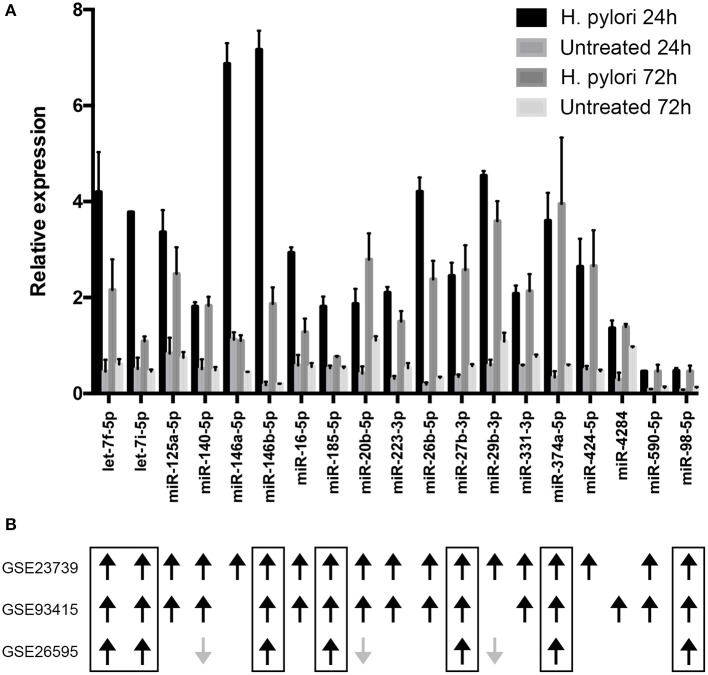
Figure 3.
Relative expression of miRNAs putatively targeting CIITA transcript. (A) miRNA expression was evaluated by microarray in macrophages infected with H. pylori for 24 or 72 h. Data are expressed relative to the average of the expression of each miRNA. SD is relative to three biological replicates. Differentially expressed miRNAs were identified according to the significance analysis of microarray (SAM) using a median false discovery rate (FDR) of 0%. (B) Results of meta-analyses. Black arrows indicate miRNAs up-regulated in gastric cancer, while gray arrows indicate miRNAs down-regulated in gastric cancer. The Limma (Linear Models for Microarray Analysis) algorithm implemented in R package was used to identify differentially expressed miRNAs statistically significant. Benjamini and Hochberg correction was used to correct p values for multiple testing and it was considered if lower than 0.05.

