Figure 6.
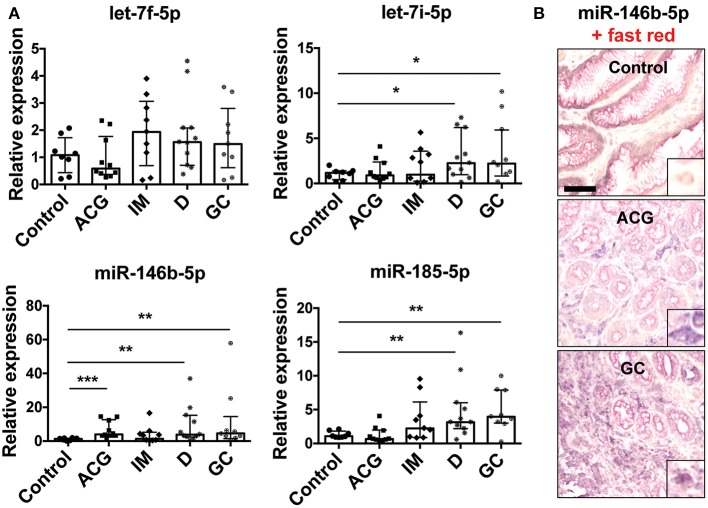
Modulation of miRNA expression in gastric biopsies. (A) Relative expression of miRNAs in gastric biopsies from control biopsies (control, n = 8), patients with active non-atrophic chronic gastritis (ACG, n = 10), patients with intestinal metaplasia (IM, n = 9), with dysplasia (D, n = 11), and patients with gastric adenocarcinoma (GC, n = 9). Data were normalized to an endogenous reference gene (U6). Values of control biopsies were taken as reference and set as 1; the expression levels for patients were relative to the expression of control biopsies. Data are expressed as median with interquartile range (IQR). Significance was determined by the Mann–Whitney U-test. *p < 0.05; **p < 0.01; and ***p < 0.001. (B) Representative images of miR-146b-5p ISH in control biopsies, ACG and GC. Scale bar: 100 μm. In each case, a higher magnification (10×) of miR-146b-5p expression in macrophages is shown as right bottom inlet.

