Figure 2.
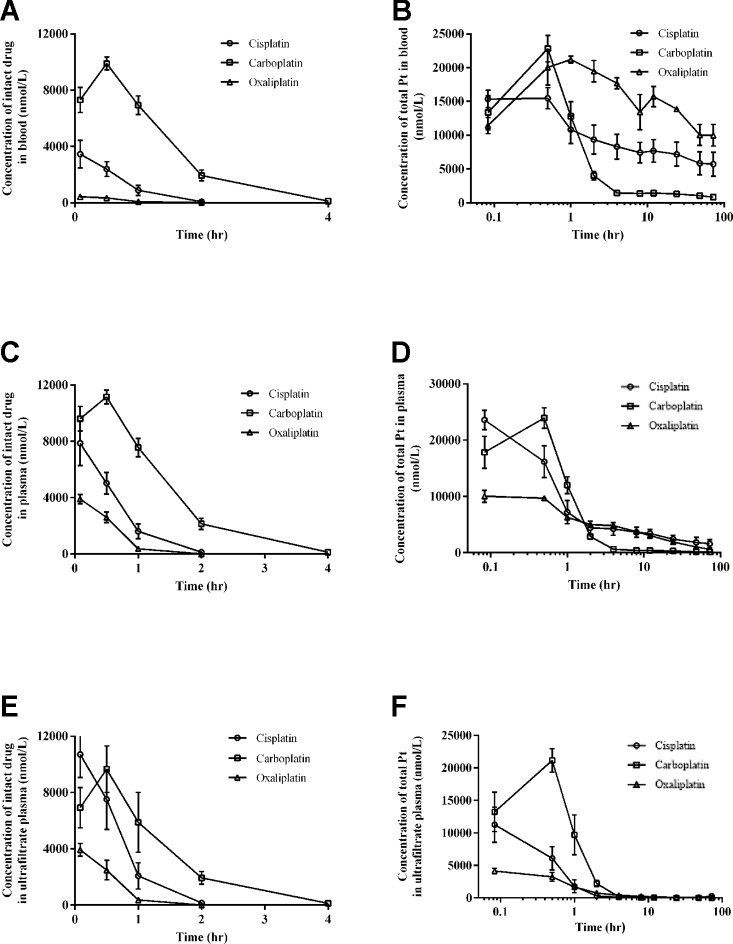
Intact drug and total platinum concentration-time profiles in blood (A and B), plasma (C and D), and ultrafiltrate plasma (E and F) after intraperitoneal injection of equal moles of three platinum-based drugs to rats (equivalent to platinum at 16.7 nmol/kg). All data are presented as mean ± sd (n = 6).

