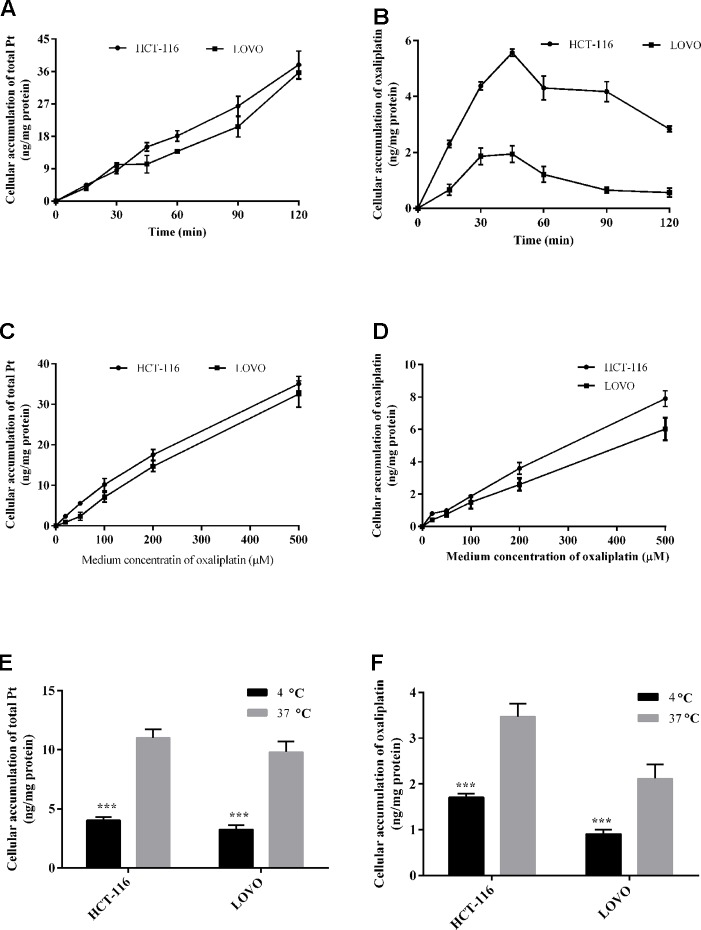
Figure 3.
Cellular total platinum (A) and intact oxaliplatin (B) over time with 200 μm oxaliplatin exposure to HCT-116 and LOVO cell lines. Uptake of total platinum (C) and intact oxaliplatin (D) in HCT-116 and LOVO cell lines at different medium concentrations of oxaliplatin (20–500 μM) for 30 min incubation. The cellular total platinum (E) and oxaliplatin (F) uptake as a function of treatment temperature with 200 μm oxaliplatin exposure to HCT-116 and LOVO cell lines for 30 min. All data are presented as mean ± sd (n = 3). The uptake difference between two groups at 4◦C and 37◦C was highly significant (***P < 0.001).

