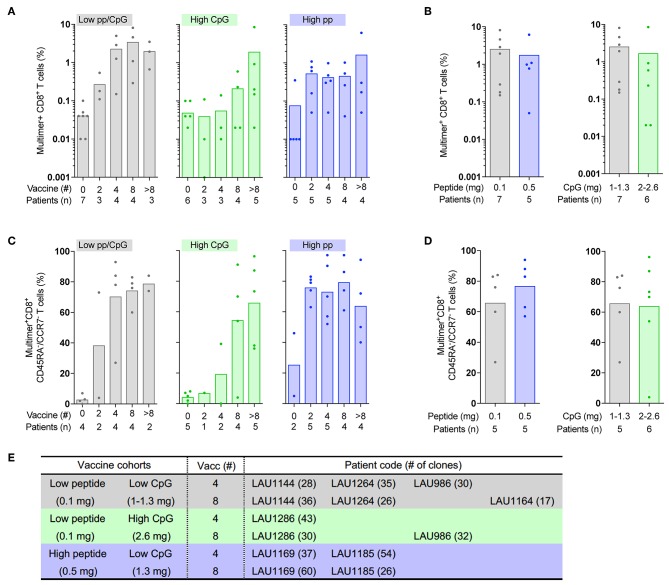
Figure 1.
Direct ex vivo frequencies and cell differentiation of circulating Melan-A-specific CD8 T-cells following vaccination with increased peptide or CpG doses. Blood samples of melanoma patients receiving monthly therapeutic vaccinations with different doses of Melan-A/ELA peptide or CpG with IFA were analyzed before the start of vaccination (0) and after the indicated numbers of vaccinations (2, 4, 8, and >8) (A,C) or at the response peak (B,D). (A–E) There were three cohorts of patients, according to the peptide or CpG dose [low peptide (0.1 mg)/low CpG (1–1.3 mg), gray bars; low peptide (0.1 mg)/high CpG (2–2.6 mg), green bars; high peptide (0.5 mg)/low CpG (1.3 mg), blue bars]. Each dot represents a single patient. (A) Quantification of Melan-A/ELA-specific CD8 T-cell frequencies. (B) Comparison of the maximum Melan-A/ELA-specific CD8 T-cell frequencies reached during the study between low vs. high peptide dose (left panel) and low vs. high CpG dose (right panel). (C) Multimerpos CD8 T-cells were characterized directly ex vivo by flow cytometry for CCR7 and CD45RA expression. Proportion of differentiated effector-memory (EM, CD45RAnegCCDR7neg) CD8 T-cells according to the type of vaccination. (D) The proportion of differentiated EM Melan-A/ELA-specific CD8 T-cells at the peak of response was compared between low vs. high peptide dose (left panel) and low vs. high CpG dose (right panel). (E) Selection of the seven melanoma patients included in this study, according to vaccine cohort and number of vaccine injections (4v vs. 8v). The number of clones generated for each patient and time-point of vaccination is indicated.

