Figure 2.
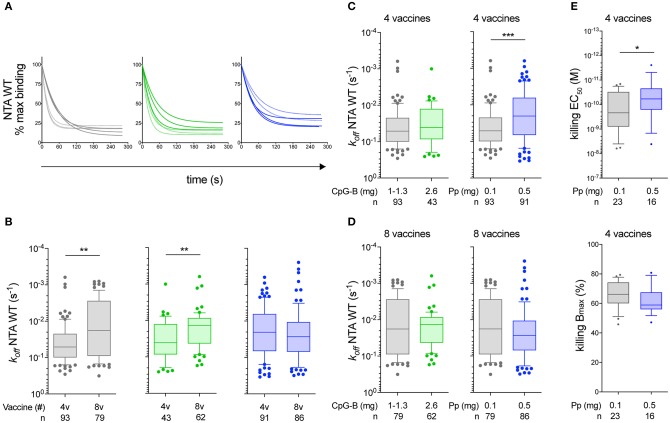
Monomeric TCR/CD8-pMHC dissociation rates (koff) of Melan-A-specific CD8 T-cell clones. (A) Representative wild-type NTAmer-based dissociation curves obtained from Melan-A-specific CD8 T-cell clones ex vivo derived from patients vaccinated with either low peptide/CpG (gray), high CpG (green), or high peptide (blue) dose protocol, after 4 (dashed curves) or 8 (plain curves) vaccinations. (B) koff values categorized according to the vaccination cohort and the number of vaccine injections (4v vs. 8v). (C,D) Direct comparison of the dissociation rates (koff) between low peptide/CpG and high CpG (left panel) or high peptide (right panel) dose cohort after 4 vaccine (C) or 8 vaccine (D) injections. (E) EC50 (top panel) and Bmax (bottom panel) values from cytolytic assays performed with chromium-labeled Melan-A-negative T2 target cells loaded with graded concentrations of native Melan-A peptide. Direct comparison between low peptide/CpG (in gray) or high peptide (in blue) dose cohort after 4 vaccine injections. (A–E) Data are representative of pooled tumor antigen-specific T-cell clones derived from EM28pos and EM28neg and are depicted as box (25th and 75th percentiles) and whisker (10th and 90th percentiles) with the middle line indicating the median. Number of clones n and P-values by Mann-Whitney U test are indicated; *P < 0.05, **P < 0.01, and ***P < 0.001. Pp, peptide.

