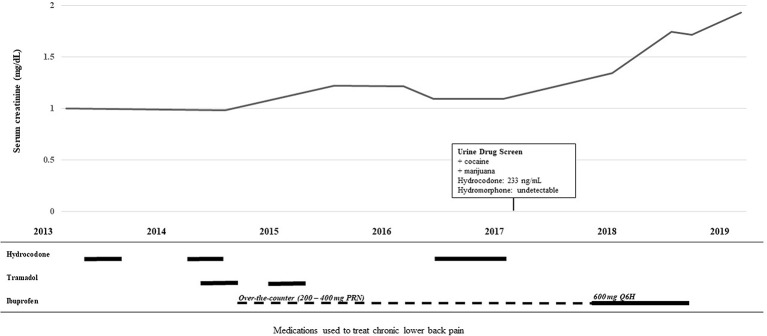
Figure 1.
Timeline of medication use and decline in renal function.The top line graph illustrates the rise in serum creatinine over time. The lower histogram illustrates the use of the analgesics hydrocodone, tramadol, and ibuprofen over the same time course. Solid lines depict the patient taking the drug for a consistent period of time and the broken line depicts the pro re nata (PRN) “as needed” use.

